Background

In my previous two articles, I walked through edge AI development on the .NET stack using the ONNX model format. Those posts relied on CPU hardware. In this article, I will extend that path and use a GPU for GenAI inference. If you want to know how much faster inference can get on GPU—or how to set up a local CUDA environment on Windows—this post is for you. Let’s get started.

Model

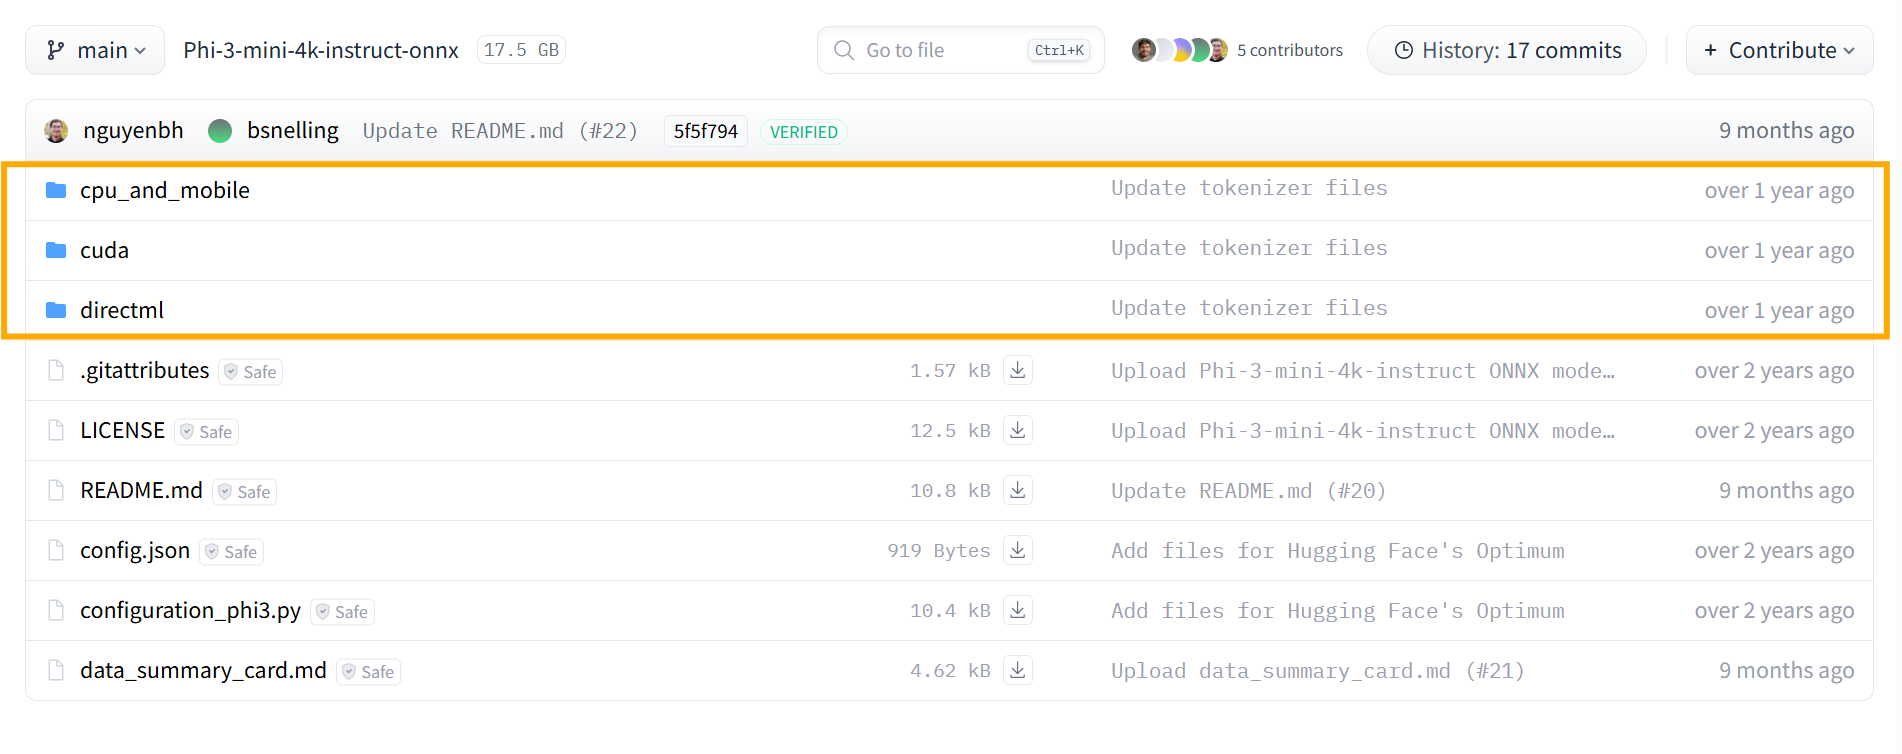
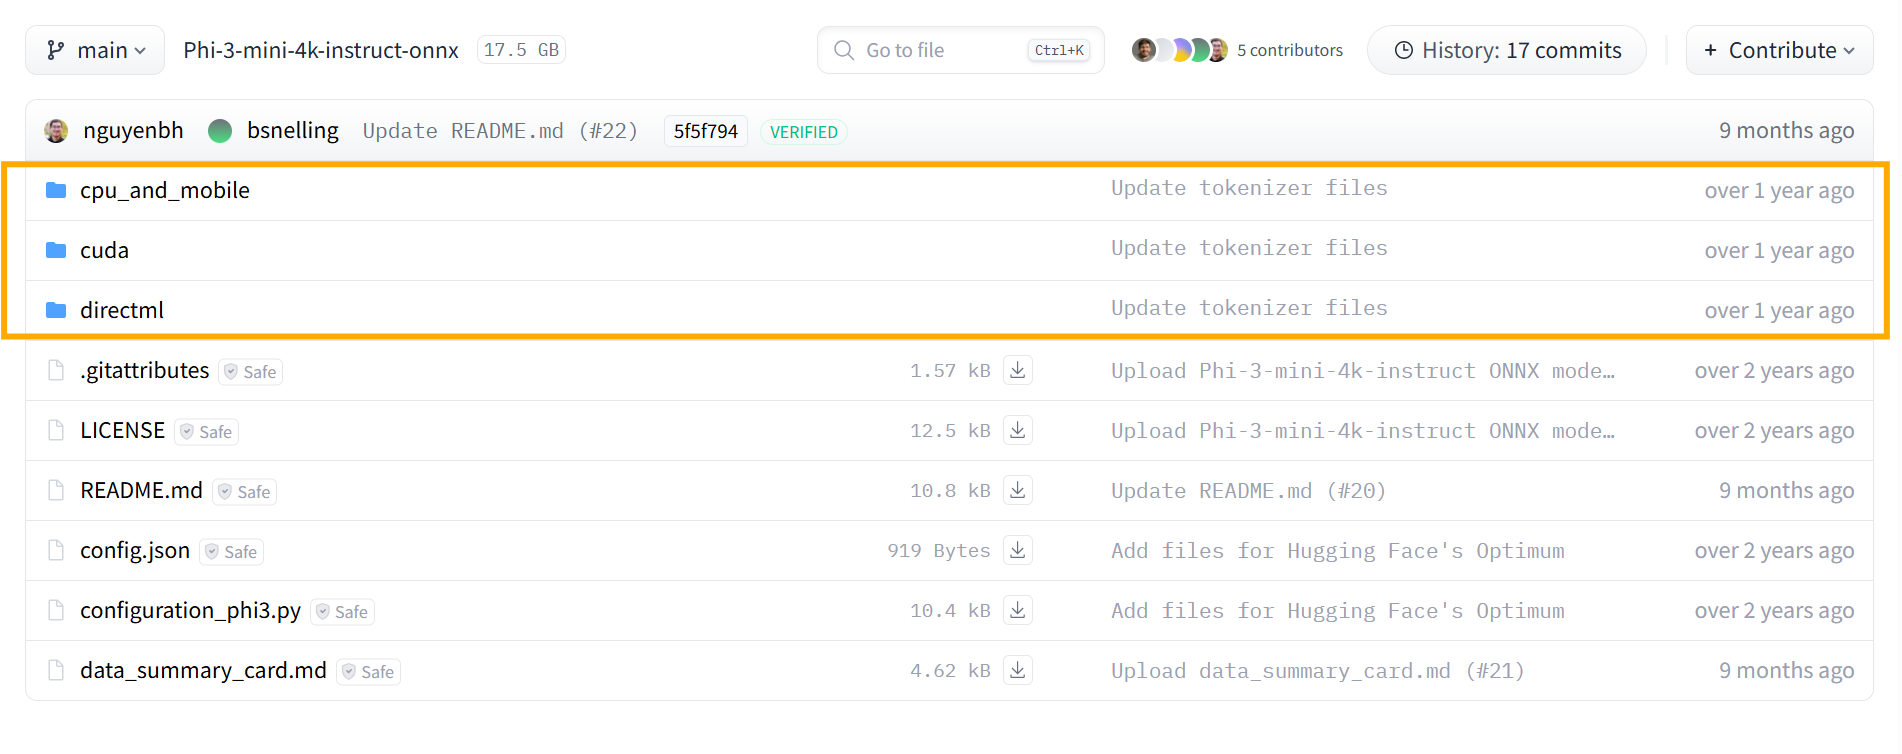
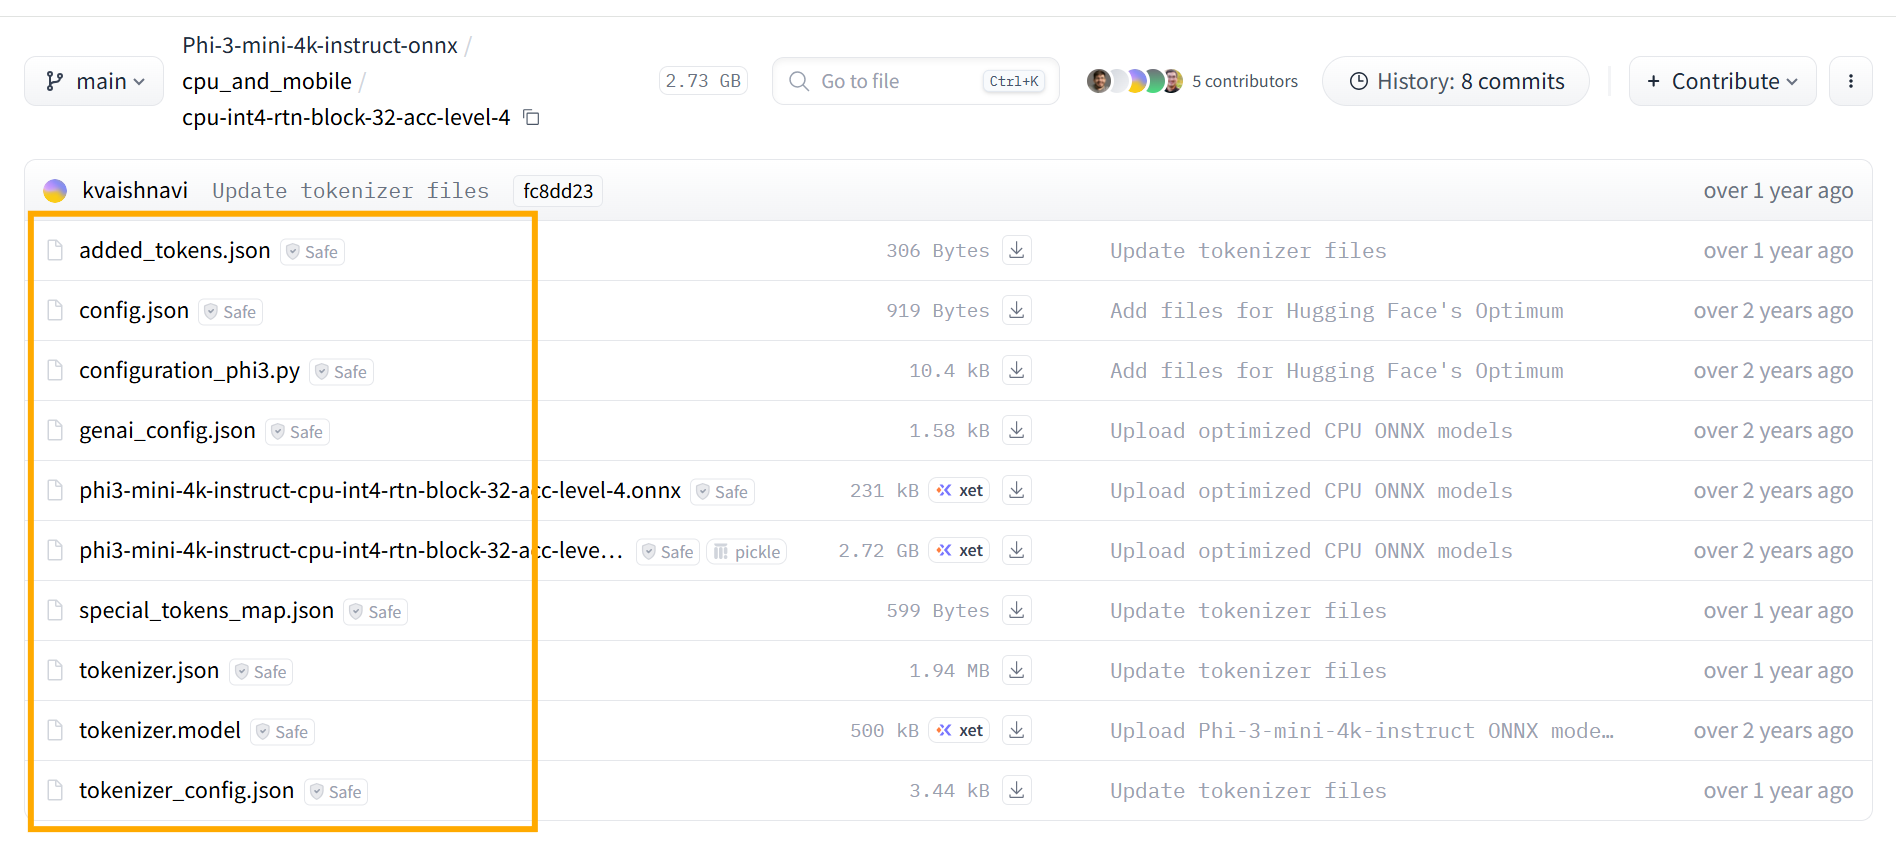
As I mentioned in the first article in this series, the Phi-3-Mini-4K-Instruct-onnx model ships in several variants for different compute targets: cuda, directml, and cpu_and_mobile.

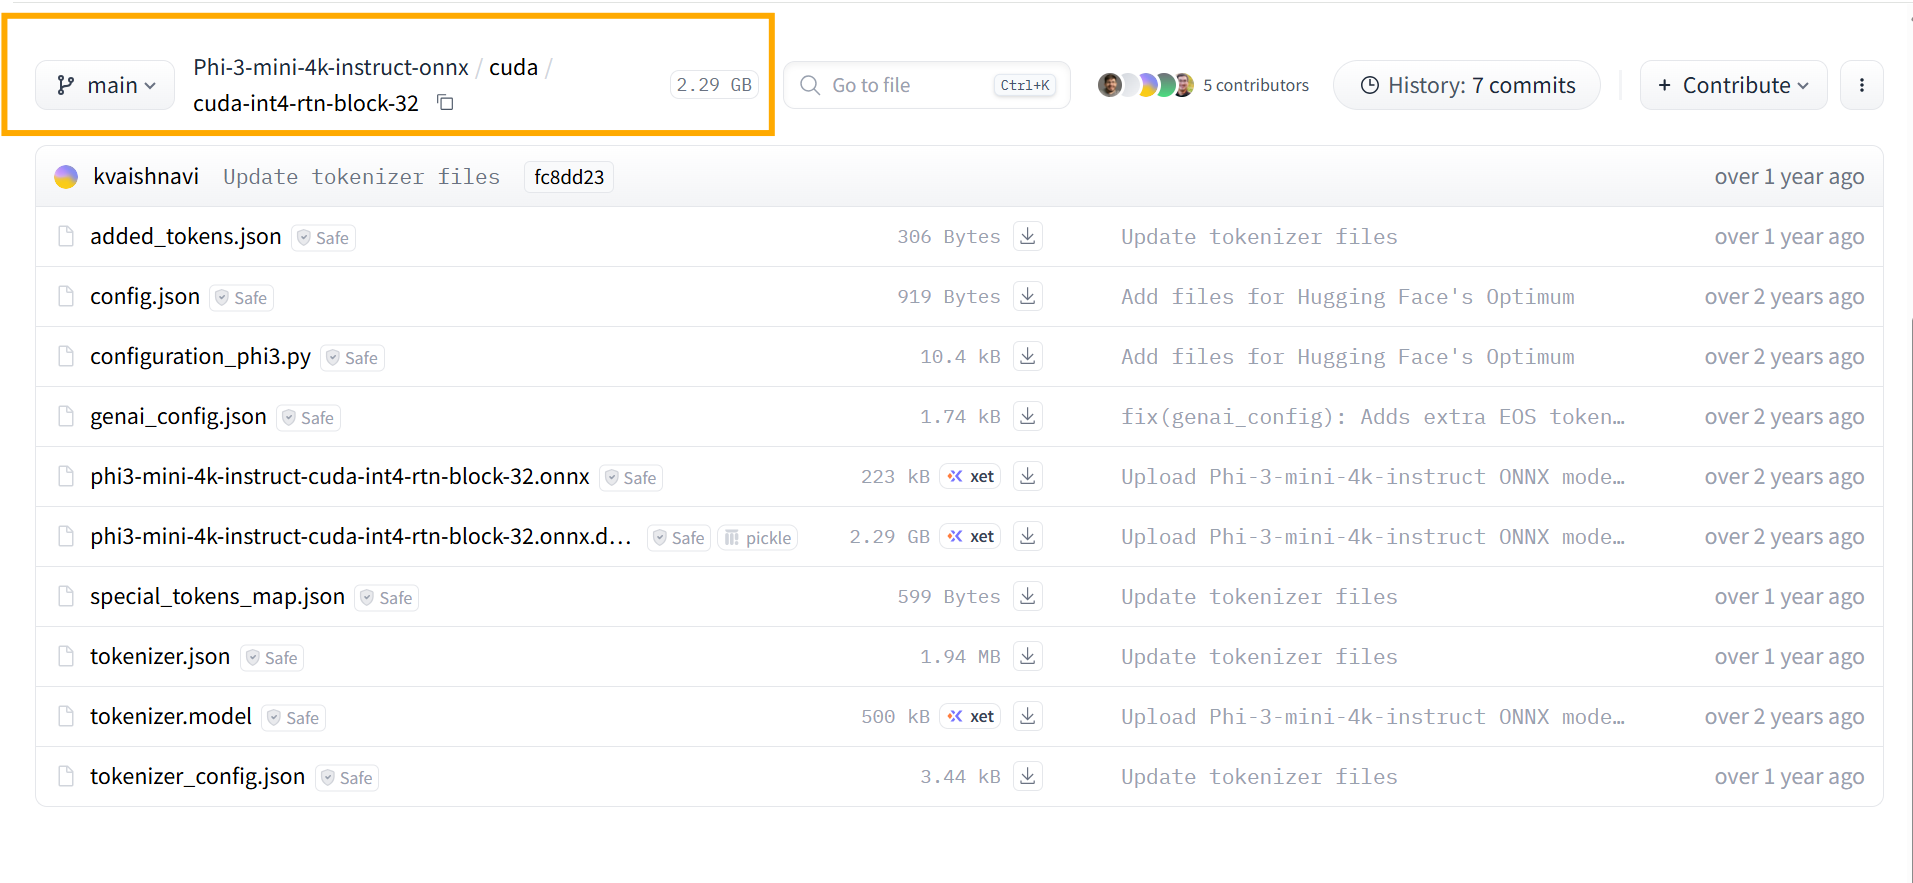
In that earlier post we used the cpu_and_mobile build. Today we switch to the cuda folder. We still use a quantized model; the weight file is about 2.3 GB.

The model’s genai_config.json makes the execution provider explicit—provider_options is set to CUDA:

1
2
3
4
5
6
7
8
9
10
11
12
13
14
15
16
17
18
19
20
21
22
23
24
25
26
27
28
29
30
31
32
33
34
35
36
37
38
39
40
41
42
43
44
45
46
47
48
49
50
51
52
53
54
55
56
57
58
59
{
"model": {
"bos_token_id": 1,
"context_length": 4096,
"decoder": {
"session_options": {
"log_id": "onnxruntime-genai",
"provider_options": [
{
"cuda": {
"enable_cuda_graph": "0"
}
}
]
},
"filename": "phi3-mini-4k-instruct-cuda-int4-rtn-block-32.onnx",
"head_size": 96,
"hidden_size": 3072,
"inputs": {
"input_ids": "input_ids",
"attention_mask": "attention_mask",
"past_key_names": "past_key_values.%d.key",
"past_value_names": "past_key_values.%d.value"
},
"outputs": {
"logits": "logits",
"present_key_names": "present.%d.key",
"present_value_names": "present.%d.value"
},
"num_attention_heads": 32,
"num_hidden_layers": 32,
"num_key_value_heads": 32
},
"eos_token_id": [
32000,
32001,
32007
],
"pad_token_id": 32000,
"type": "phi3",
"vocab_size": 32064
},
"search": {
"diversity_penalty": 0.0,
"do_sample": false,
"early_stopping": true,
"length_penalty": 1.0,
"max_length": 4096,
"min_length": 0,
"no_repeat_ngram_size": 0,
"num_beams": 1,
"num_return_sequences": 1,
"past_present_share_buffer": true,
"repetition_penalty": 1.0,
"temperature": 1.0,
"top_k": 1,
"top_p": 1.0
}
}

Next step, let’s look at the hardware I used for this demo.

GPU hardware

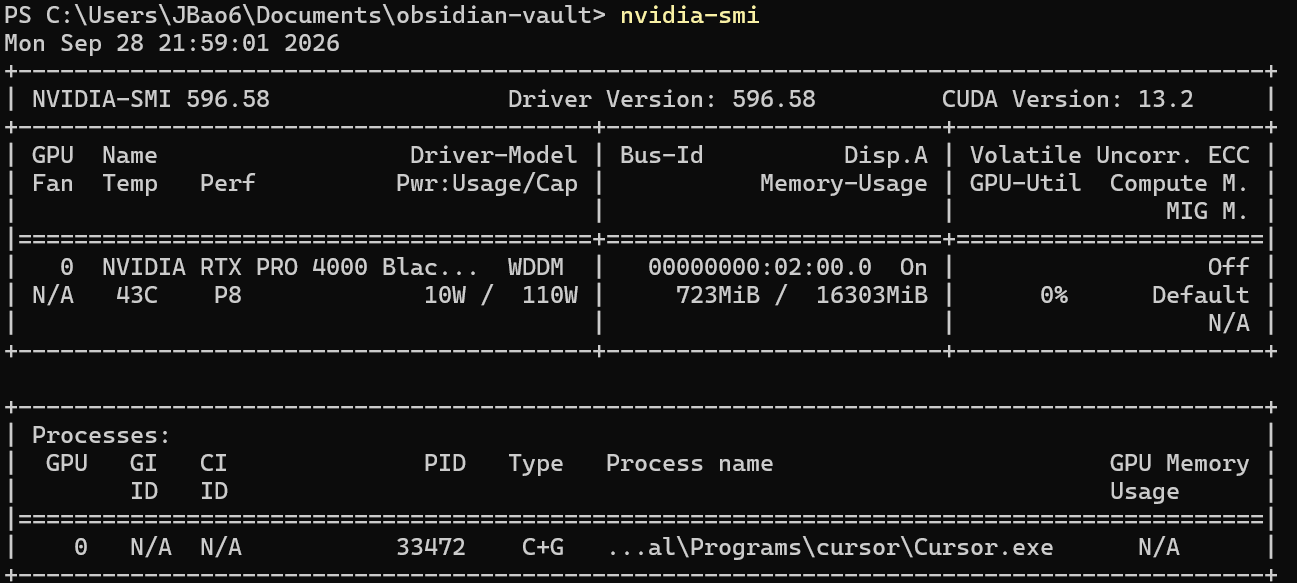
My machine has an NVIDIA RTX PRO 4000 Blackwell Generation Laptop GPU:

It has 16 GB of VRAM—enough headroom for small models like Phi-3-Mini-4K-Instruct-onnx. Great, right?

Environment

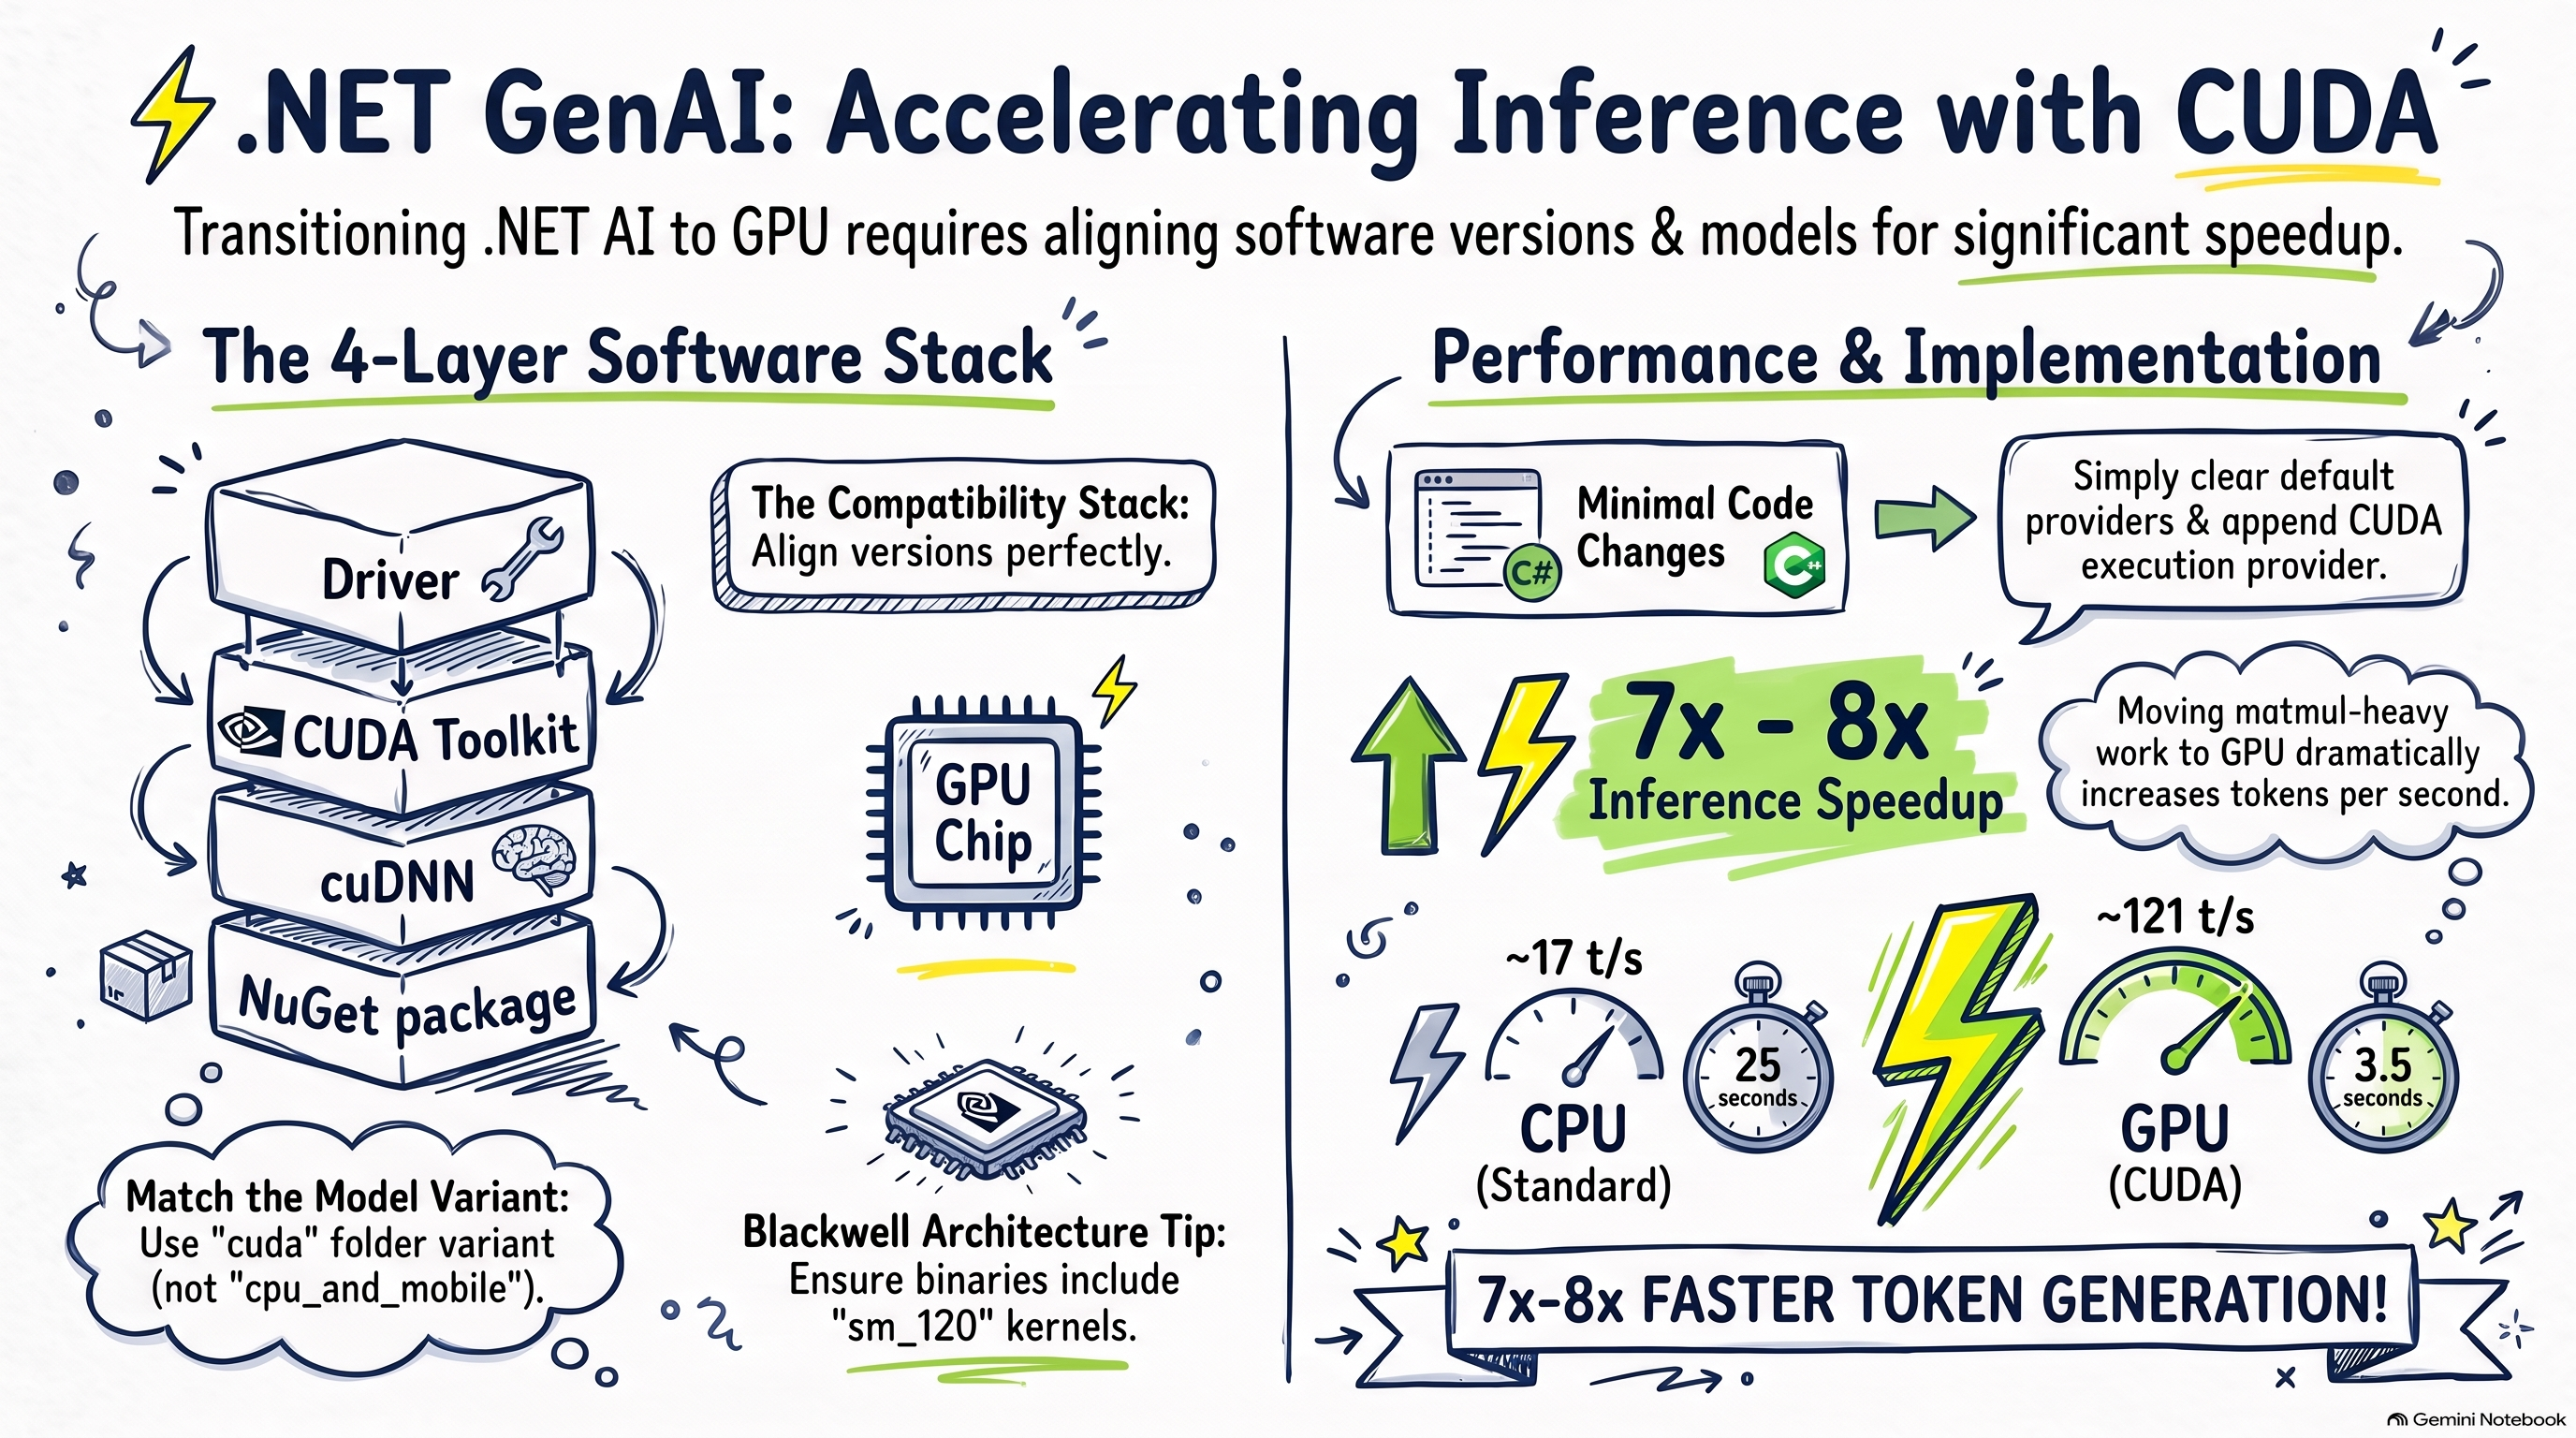
To run this ONNX model on GPU with CUDA, you need four layers of software on top of the hardware:

  • NVIDIA driver — required for any GPU workload; nothing special to add here.
  • CUDA Toolkit — the CUDA SDK (compiler, runtime, debugger, and related tools). Pick a toolkit version that matches your GPU generation. On my Blackwell laptop I use CUDA 13.4. Installing the toolkit takes time, so confirm your GPU architecture and the ORT/GenAI package requirements before you install.
  • cuDNN — NVIDIA’s deep learning primitives library; ONNX Runtime GPU depends on it.
  • Microsoft.ML.OnnxRuntimeGenAI.Cuda — the .NET package for CUDA. It pulls in native dependencies such as ONNX Runtime GPU. Package version must align with your CUDA stack—for example, 0.16.0 targets the CUDA 13 line.

Setting this up involves trial and error; give yourself some patience. Once everything is in place, we can move to the demo.

Demo

Switching from CPU to GPU does not require rewriting your agent. You mainly change how the model is loaded.

Lower-level API:

1
2
3
4
5
6
7
8
9
using Microsoft.ML.OnnxRuntimeGenAI;

string modelPath = @"C:\path\to\cuda-model";
using Config config = new Config(modelPath);

config.ClearProviders();
config.AppendProvider("cuda");

using Model model = new Model(config);

Higher-level API (Microsoft.Extensions.AI):

1
2
3
4
5
6
7
8
9
10
11
12
13
14
15
using Microsoft.Extensions.AI;
using Microsoft.ML.OnnxRuntimeGenAI;

string modelPath = @"C:\path\to\cuda-model";

using Config config = new Config(modelPath);
config.ClearProviders();
config.AppendProvider("cuda");

using var client = new OnnxRuntimeGenAIChatClient(config);

ChatResponse response = await client.GetResponseAsync("Hello", new ChatOptions
{
MaxOutputTokens = 64,
});

The important line is AppendProvider("cuda").

As we mentioned above, the model folder must be the cuda variant (not cpu_and_mobile). The config snippet simply tells ONNX Runtime GenAI to use the CUDA execution provider at runtime.

CPU vs GPU throughput

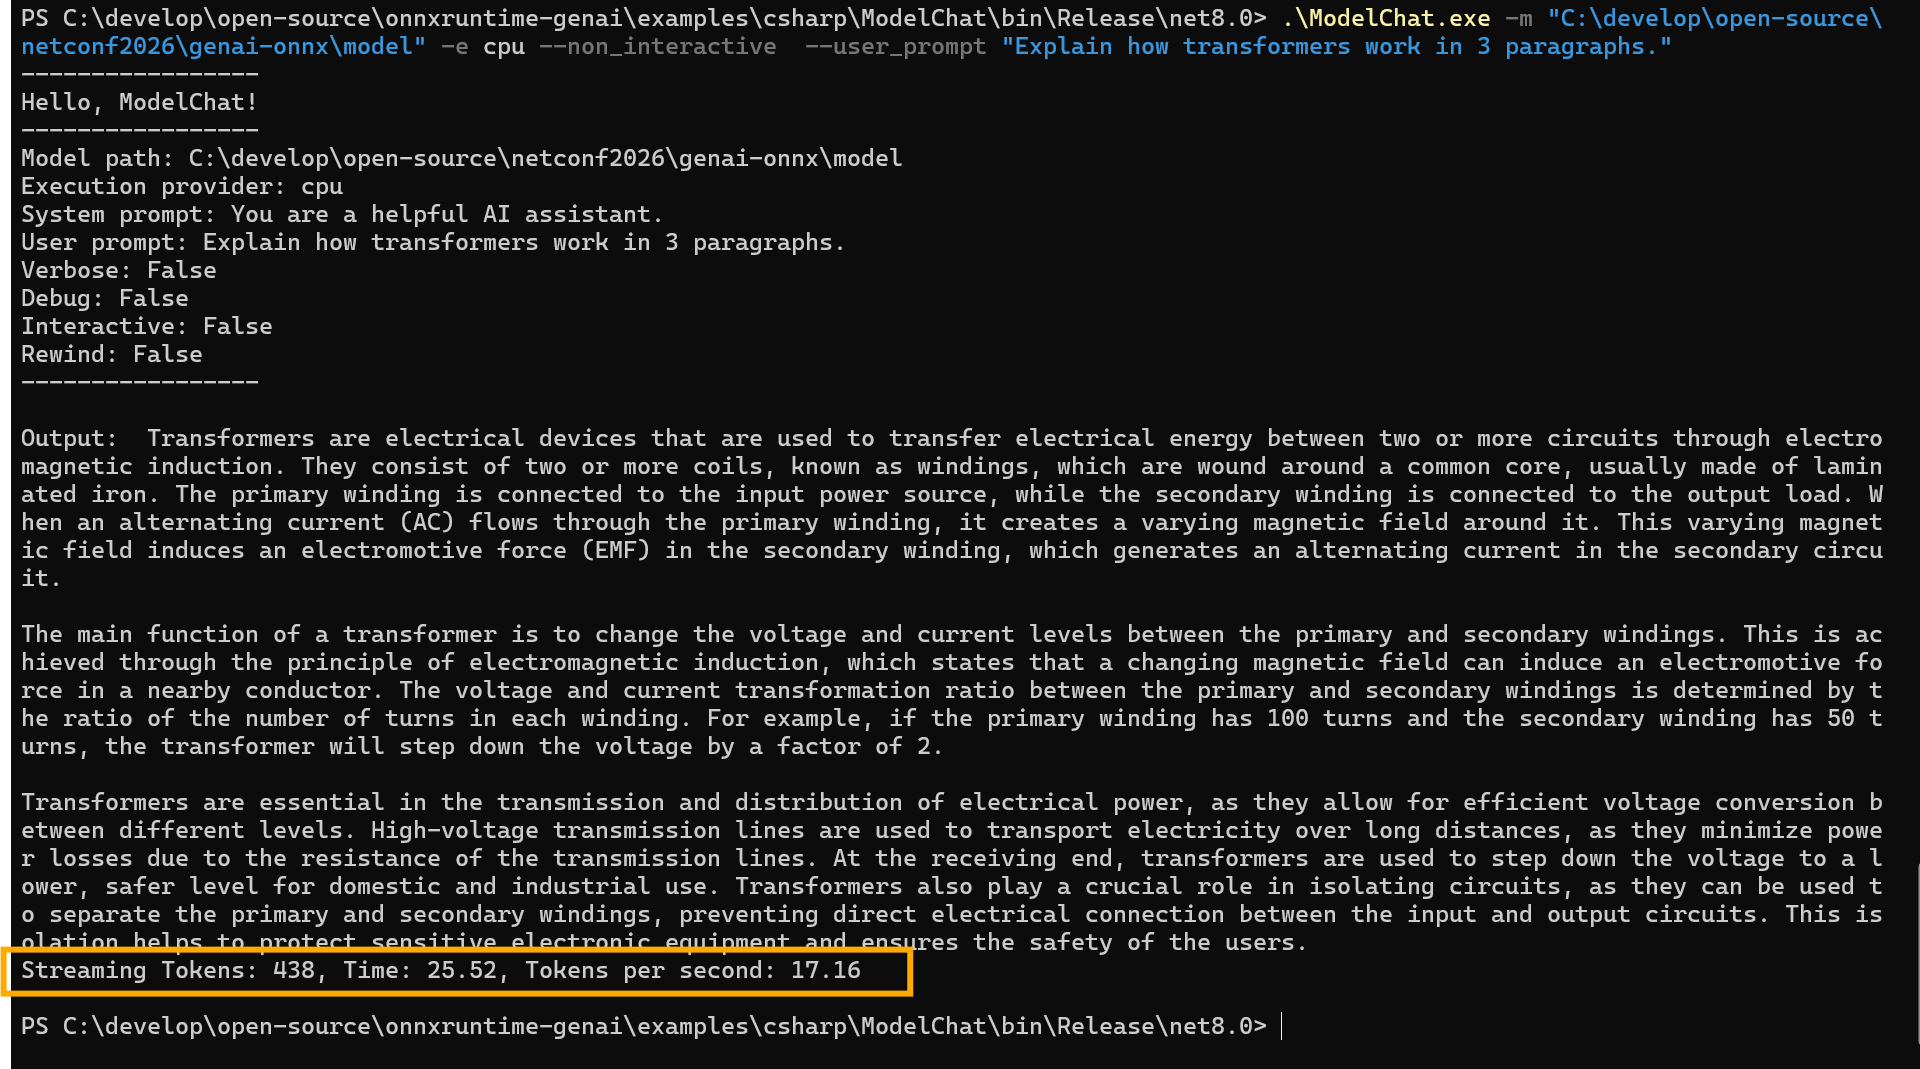
First, the CPU run:

438 tokens in 25 seconds — about 17 tokens/s.

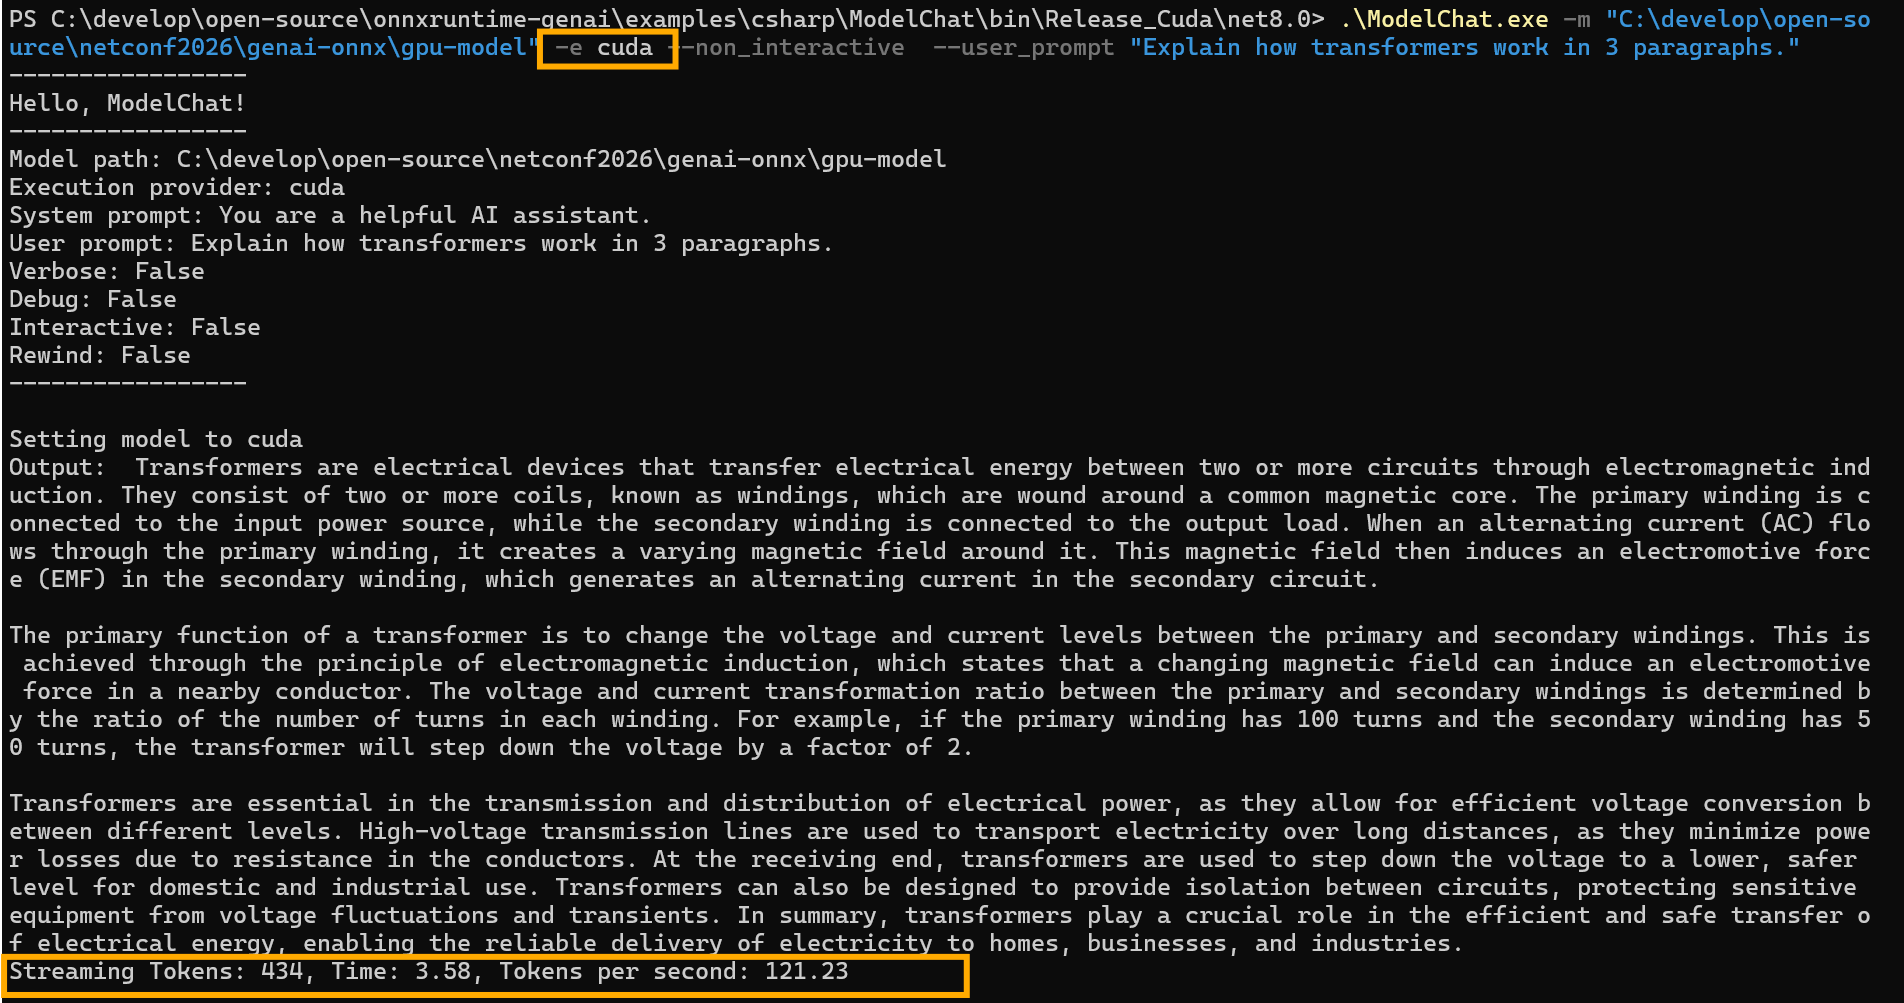
Then the GPU run:

Same 438 tokens in 3.5 seconds — about 121 tokens/s. That is roughly a 7–8× speedup. Smart design, right? Most of the win comes from moving matmul-heavy work off the CPU and onto the GPU execution provider.

Summary

After reading this post, you should understand:

  • Why the Hugging Face cuda ONNX build pairs with OnnxRuntimeGenAI.Cuda on .NET.
  • The four-layer stack: driver → CUDA Toolkit → cuDNN → GenAI CUDA NuGet—and why versions must match (especially on newer GPUs such as Blackwell).
  • How little code changes when you switch providers: ClearProviders() + AppendProvider("cuda").
  • What kind of speedup to expect on a small quantized Phi-3 model when CPU and GPU are compared fairly.

## Why AI Agents Need a New OAuth Extension
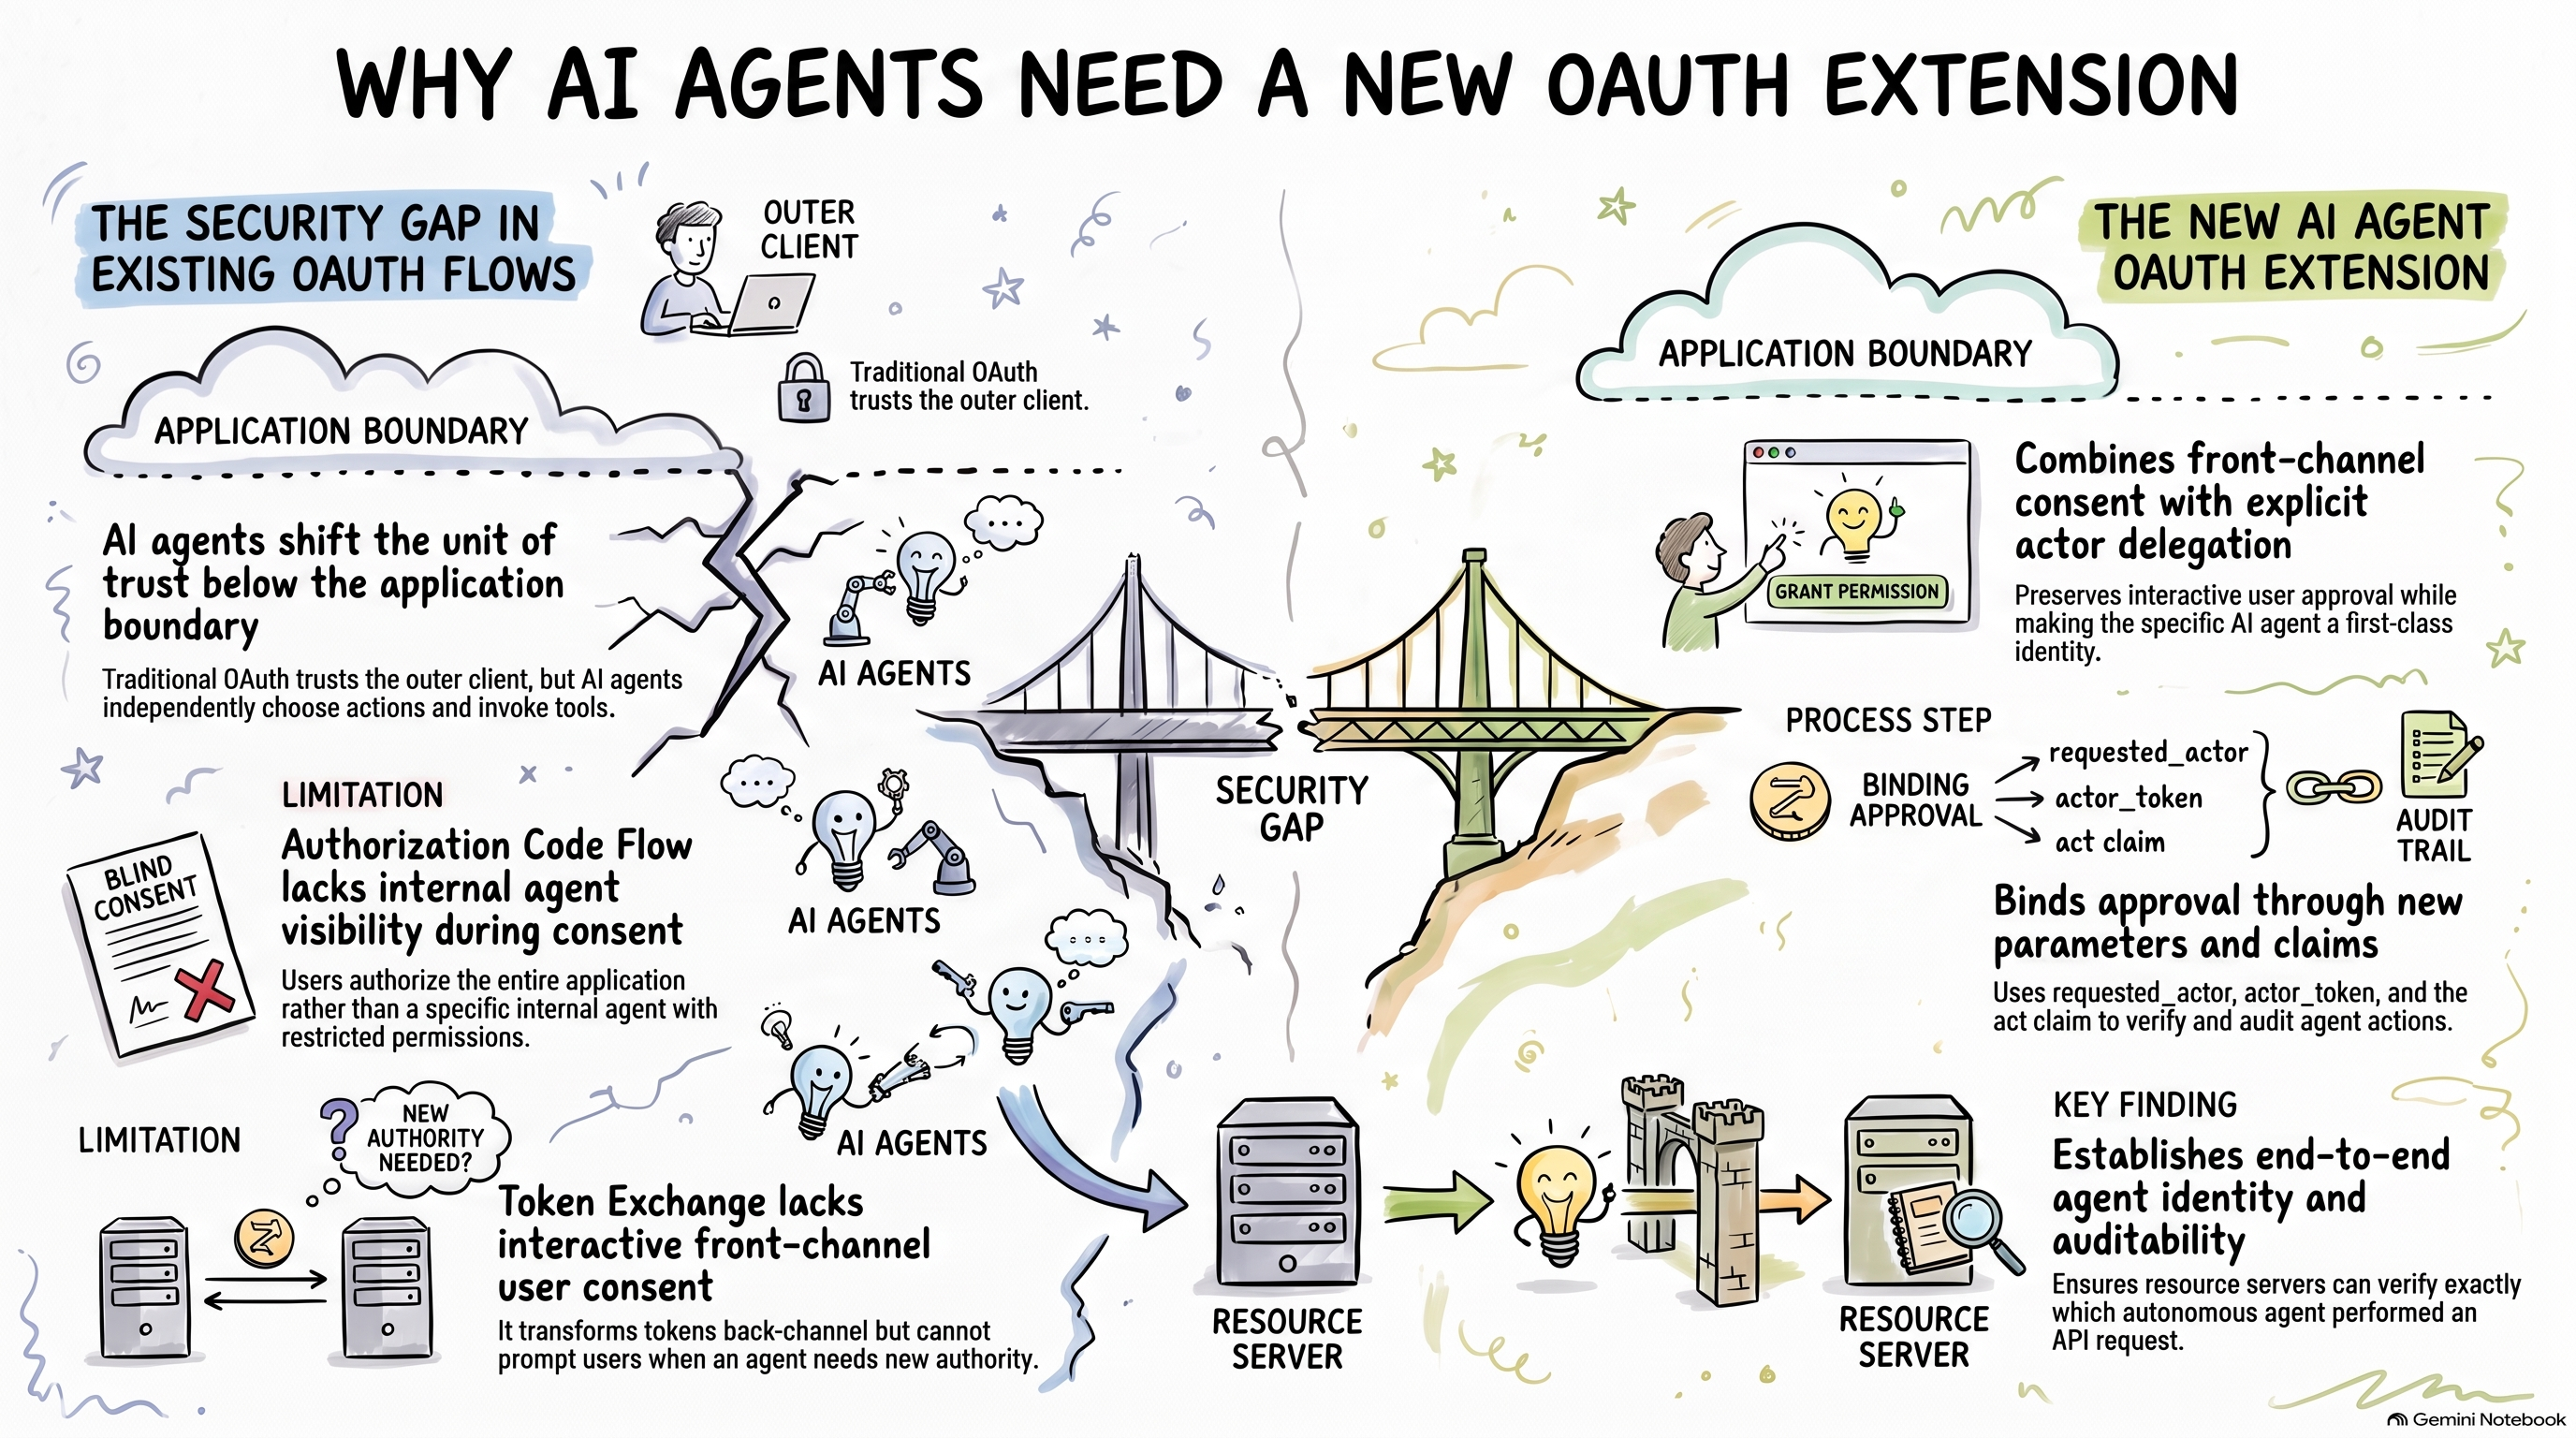
OAuth 2.0 was designed in an era where the main security question was straightforward: how can a user authorize an application to access a protected resource? That model still works well for traditional web apps and APIs, but AI agents introduce a new kind of actor into the system. An AI agent is not just a browser, not just a backend service, and not merely a normal client application. It is a decision-making component that can interpret user goals, choose actions, and call tools or APIs with a degree of autonomy. That shift matters for authorization.

To understand why a new OAuth extension is needed for AI agents, it helps to start with the two existing patterns: the standard Authorization Code Flow and OAuth Token Exchange. Both solve important problems. But neither fully captures what it means for a specific AI agent to act on behalf of a user.

1. What the Standard Authorization Code Flow Solves

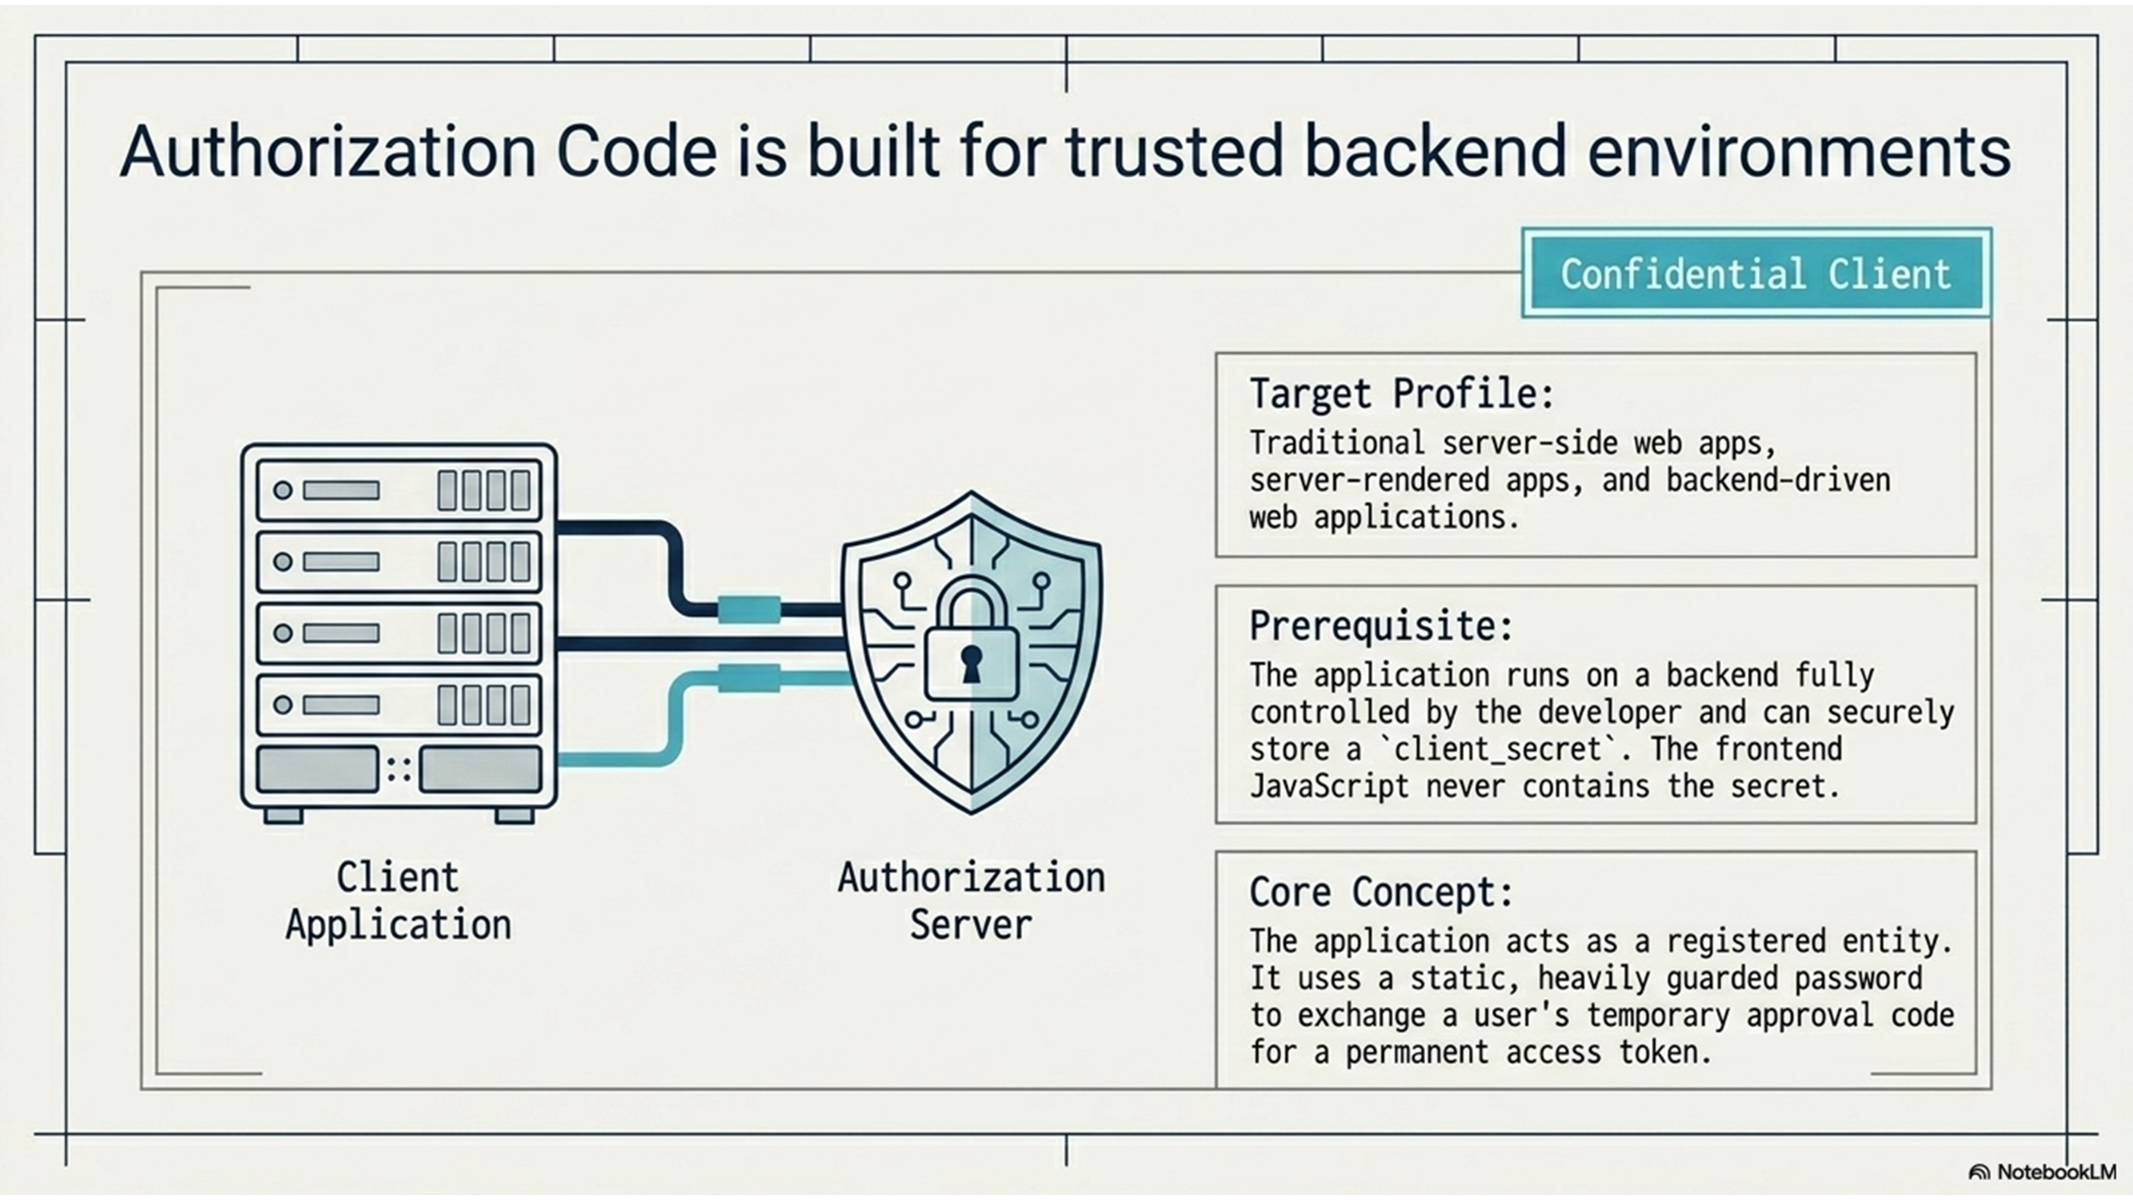
The standard Authorization Code Flow for a server-side web app is built around a simple trust model.

A user is redirected to the authorization server, signs in, and grants consent. The authorization server then returns an authorization code to the application. The backend redeems that code using its client_id and client_secret, and receives tokens. The basic meaning of this flow is clear:

  • the user approved access
  • the application proved its identity as the registered client
  • the authorization server issued tokens based on that combination

This is a strong design for classic web applications because it binds user approval to a trusted confidential client. It also protects the token exchange step by requiring the backend to authenticate itself with a client_secret or similar credential.

However, this model only really understands two important parties:

  • the user
  • the client application

That was enough when the client application was assumed to be the only meaningful actor. But in an AI system, that assumption starts to break down.

2. Why the Standard Authorization Code Flow Is Not Enough for AI Agents

Inside an AI application, there may be multiple internal agents with very different behaviors and risk profiles. One agent may summarize emails. Another may send messages. Another may create financial reports or call external systems. From a security point of view, those are not all the same thing.

But standard Authorization Code Flow has no native way to express that distinction.

When the user consents in the classic flow, the consent screen can say:

  • this application wants access
  • these scopes are requested

What it cannot clearly say is:

  • this specific agent inside the app wants to act for you
  • this agent may read your calendar but not send email
  • this agent is the one that will perform the next step autonomously

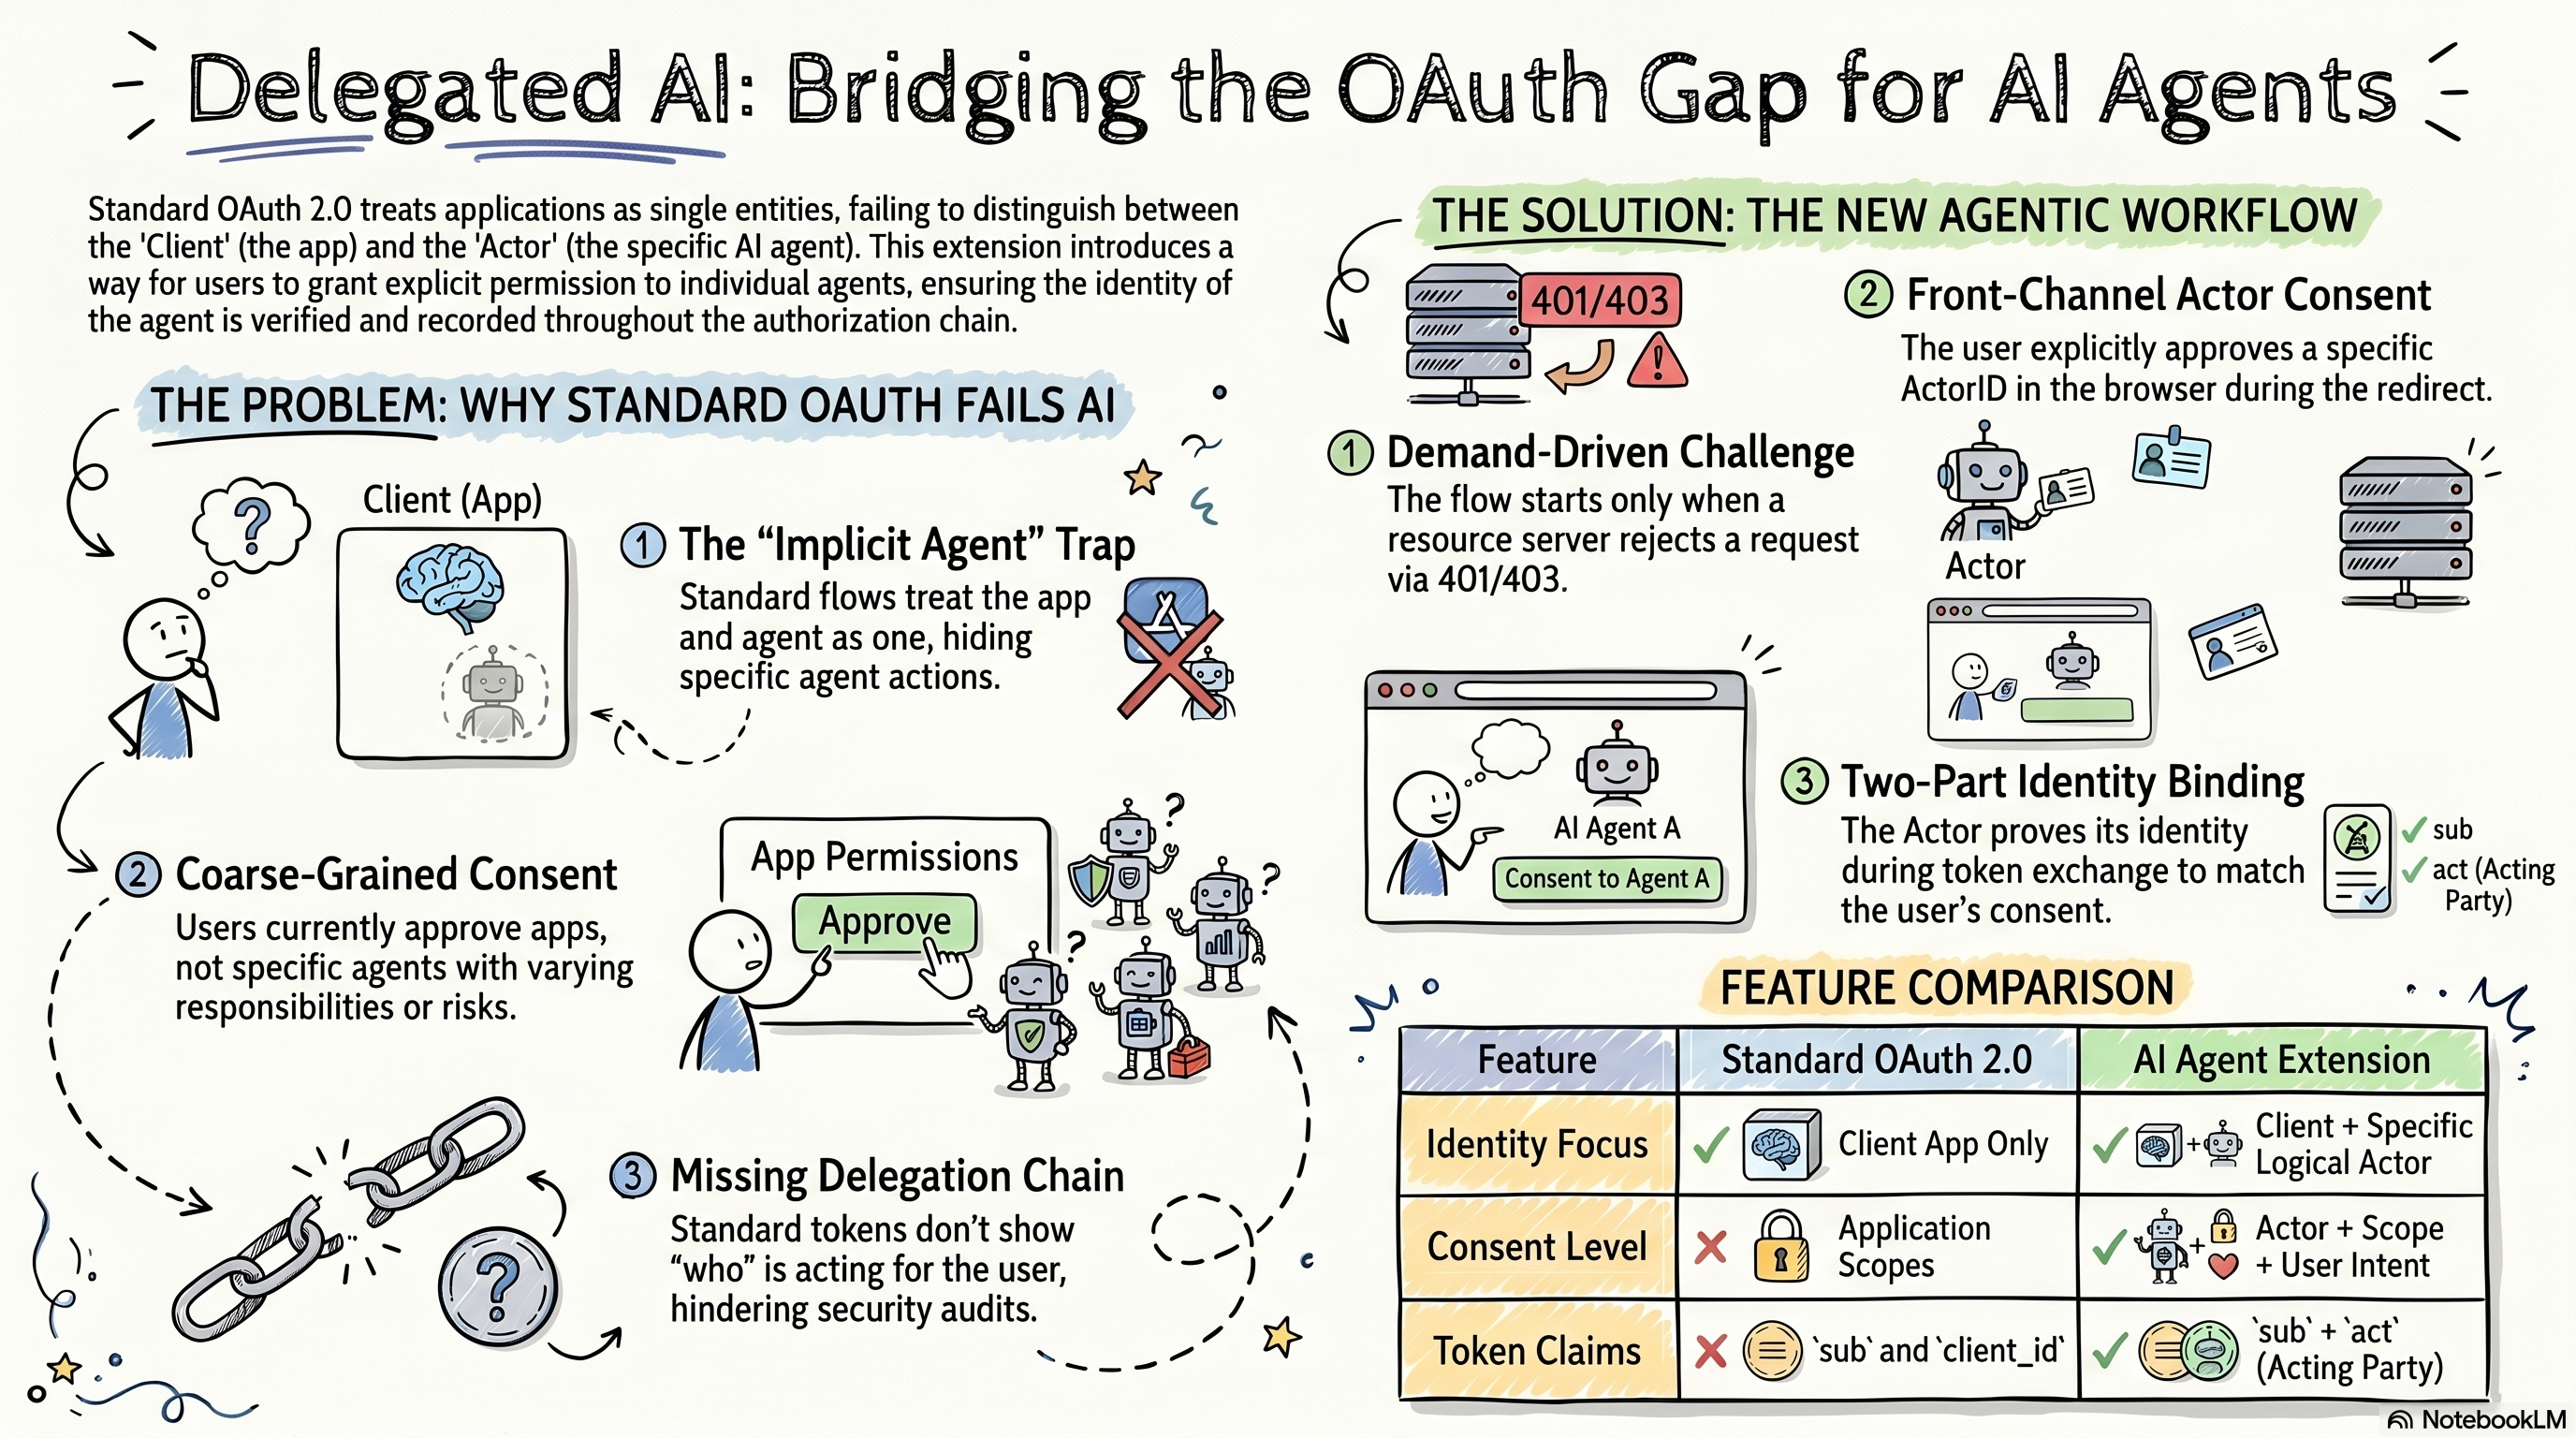
In other words, the standard flow gives consent to the client, not to the internal actor. That creates a visibility gap. The authorization server knows which app received consent, but it does not know which agent inside that app is actually going to act. The resource server later sees a token, but it may only know the user and the client, not the specific agent making decisions.

That gap becomes important because AI agents are not passive code paths. They can choose actions dynamically. They can chain tools together. They can operate across multiple hops. If the protocol cannot identify the acting agent, then user delegation becomes too coarse. The user is effectively authorizing the whole application, even if only one specific agent should be trusted for a given task.

Fixing that gap might require richer delegation in the token, not just a better consent screen — which is why Token Exchange is often discussed alongside agents.

3. What OAuth Token Exchange Solves

OAuth Token Exchange, described in RFC 8693, addresses a similar problem in micro service architectures.

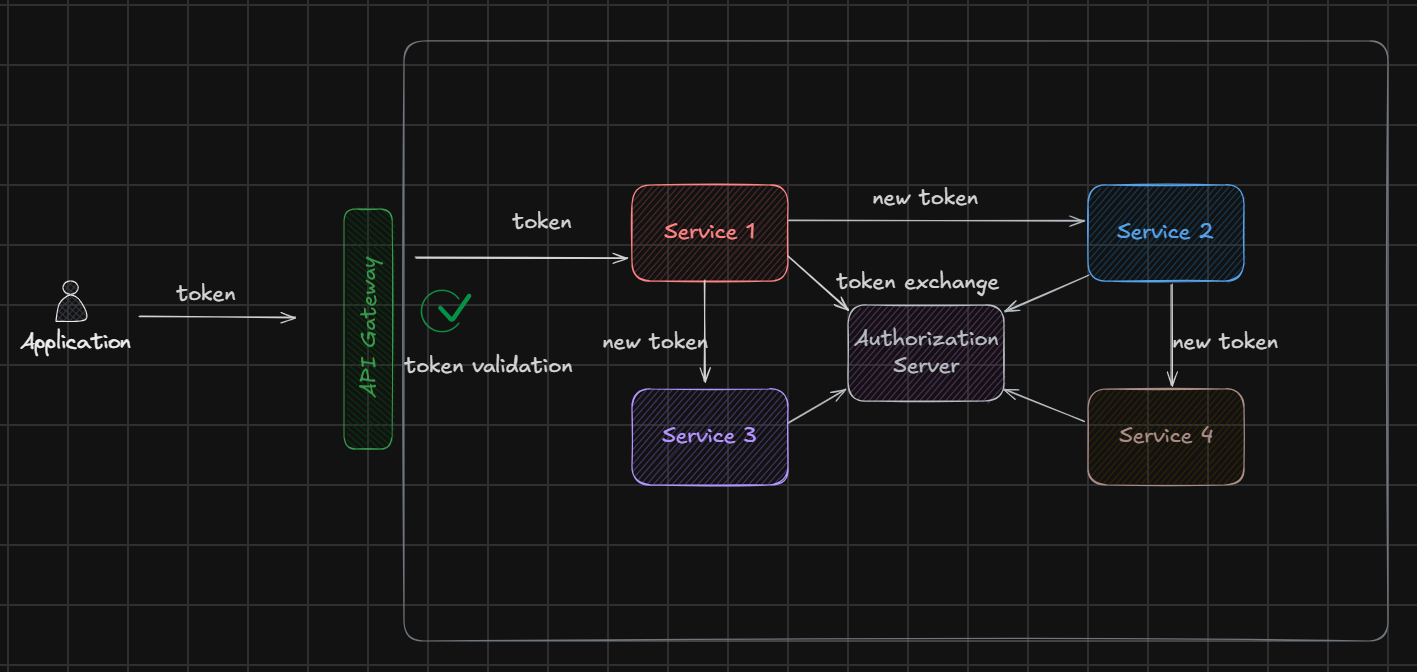
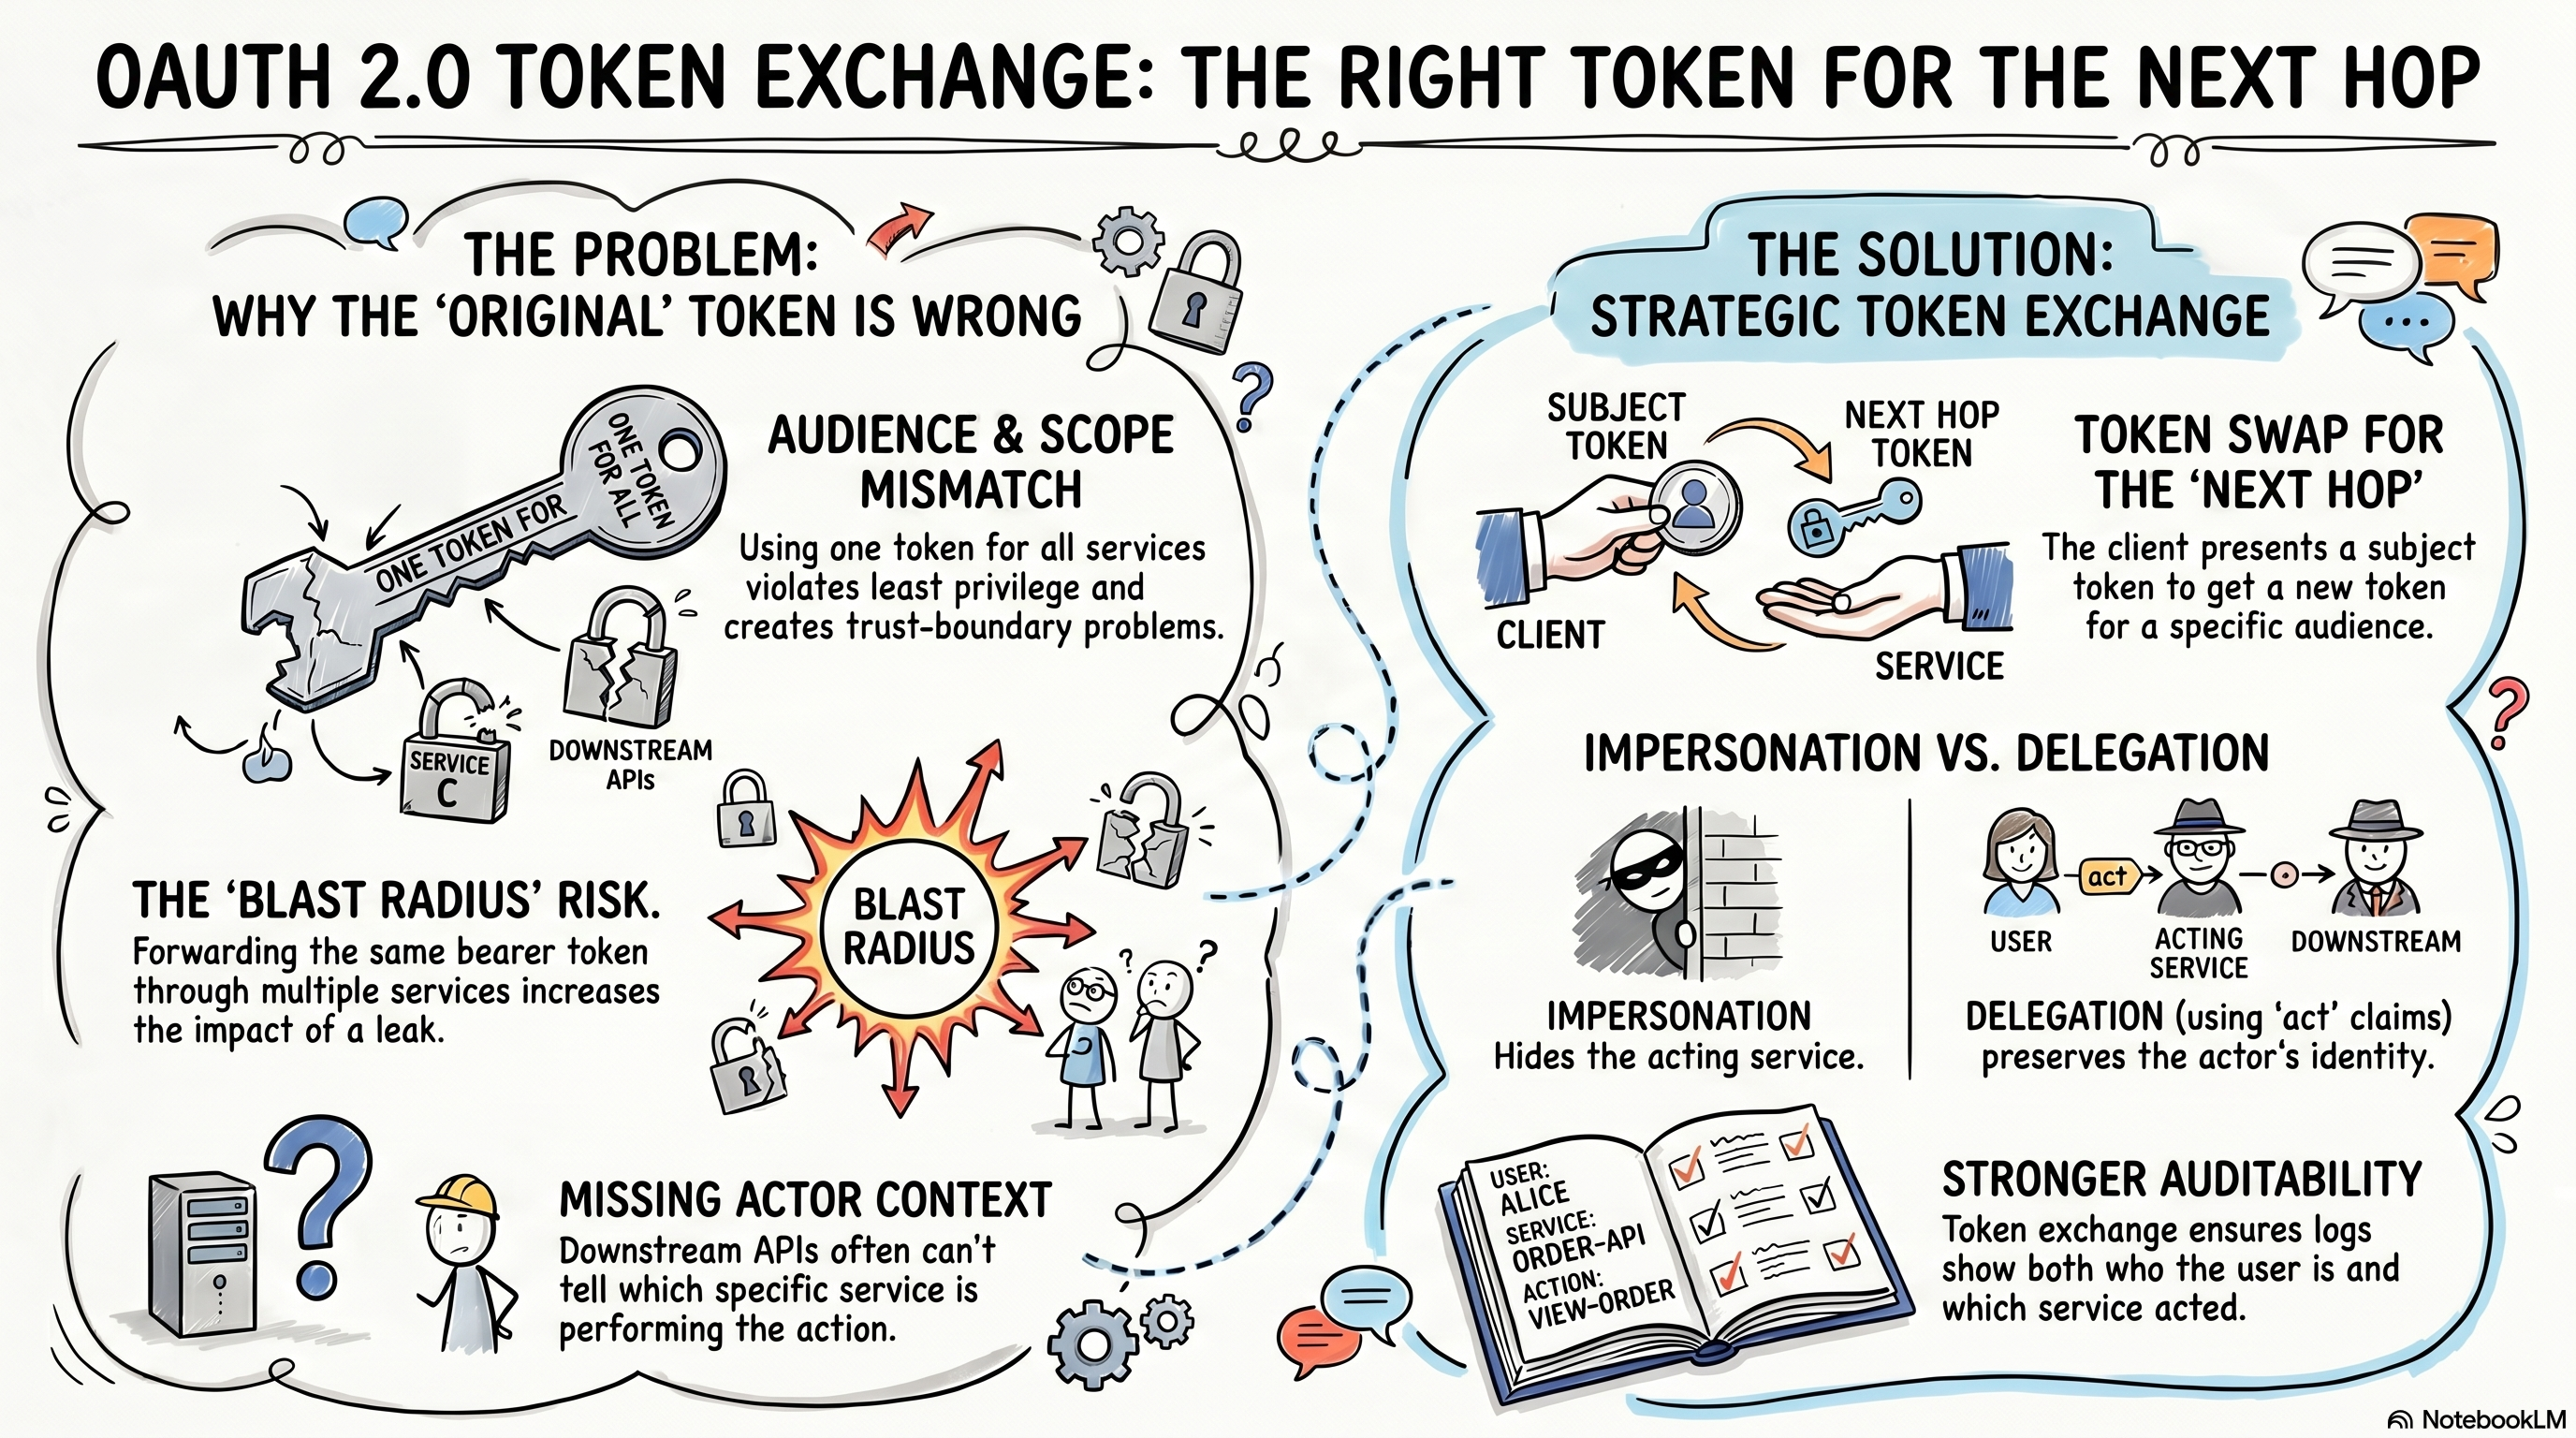
It starts from the idea that one token is often the wrong token for the next hop. A frontend service may receive a user token, but a downstream API may need a different token with a different audience, narrower scope, or explicit delegation context. Instead of blindly forwarding the original token, the service can exchange it for a new one better suited for the downstream service.

This is valuable for several reasons:

  • it reduces scope
  • it enforces correct audience boundaries
  • it improves trust separation between services
  • it can preserve delegation semantics using actor-related claims such as act

This is already much closer to the AI-agent problem than classic Authorization Code Flow is. Token Exchange understands that the entity presenting a token and the subject represented by that token may not be the same party. It gives us a more precise model for multi-hop systems.

That is why Token Exchange feels like an important building block for agent security.

4. Why Token Exchange Still Is Not Enough for AI Agents

Even though Token Exchange is closer to what AI agents need, it still does not fully solve the problem.

The biggest reason is that Token Exchange is mainly a back-channel mechanism. It assumes the calling service already has some token or authority and now wants to transform it into a different token for another context. That works well in service-to-service architectures. But AI-agent delegation often needs something more: explicit user consent in the front channel.

An AI agent may decide that it now needs permission to access a new resource or perform a higher-risk action. At that moment, the system should not simply assume that the client can translate existing authority into agent authority. The user may need to be asked directly:

  • do you allow this specific agent to act for you?
  • do you allow it for these scopes?
  • do you allow it in this context?

Plain Token Exchange does not define that consent step. It helps you transform authority, but it does not define how the user approves a particular internal agent in the first place.

There is also another limitation: Token Exchange can model delegation, but it does not make the AI agent a first-class identity in the end-to-end flow. In many AI systems, the real security question is not just “does the application have permission?” but “which exact agent is exercising that permission right now?” If that identity is not explicitly captured and verified, then the protocol cannot strongly bind user approval to the acting agent.

5. The Core Problem: AI Agents Create a New Security Boundary

Traditional OAuth assumes the client application is the relevant unit of trust. In an AI system, that is no longer always true.

The client is still important, but now there is a second boundary inside the client:

  • the client is the application boundary
  • the agent is the decision-making boundary

That distinction matters because the agent is often the component that interprets intent and chooses actions. It is the one deciding whether to query a calendar, send a message, call a database, or invoke another tool. If the security system only sees the outer client, it misses the actual actor driving the behavior.

This creates several risks:

  • the user may consent to an application without understanding which agent will act
  • one agent may misuse permissions intended for another agent
  • the authorization server may be unable to verify that the same agent approved in the consent step is the one redeeming the delegation
  • the resource server may be unable to audit which specific agent performed the action

In short, AI agents introduce a new layer of autonomy, and that autonomy needs to become visible to the authorization system.

6. What the New OAuth Extension Adds

Although OAuth has not yet published a formal RFC for AI-agent authorization, the OAuth working group and individual developers have already contributed a number of approaches. This article walks through one such proposal as an example; other drafts and designs are worth exploring separately.

That proposal is the draft OAuth 2.0 Extension: On-Behalf-Of User Authorization for AI Agents. https://www.ietf.org/archive/id/draft-oauth-ai-agents-on-behalf-of-user-01.html

The new OAuth extension for AI agents addresses this by combining the strengths of the two older models.

From Authorization Code Flow, it keeps the front-channel consent model. The user is still redirected to the authorization server and can still approve access interactively.

From Token Exchange, it borrows the delegation mindset. The final token should not merely represent “the app acting for the user.” It should represent “this specific agent acting for the user through this client.”

To make that work, the extension adds new protocol elements such as:

  • a requested_actor parameter in the authorization request
  • an actor_token in the token request
  • an act claim in the resulting access token

These additions matter because they create a full chain of authorization meaning:

  1. The client tells the authorization server which agent is requesting delegation.
  2. The user consents not only to the app and scope, but also to that specific agent.
  3. The agent proves its identity later using an actor_token.
  4. The authorization server verifies that the actor redeeming the flow is the same actor the user approved.
  5. The resulting access token records both the user and the agent.

That closes the gap that exists in both older flows.

7. Why This Is Better Than Reusing the Old Flows As-Is

Without the new extension, a system would have to improvise.

If it used only Authorization Code Flow, it could authenticate the app and capture user consent, but it would not clearly identify the internal agent. The user’s approval would be too broad.

If it used only Token Exchange, it could model delegation better, but it would miss the front-channel consent experience needed for user-approved agent behavior. The protocol would know how to transform authority, but not how to get the user’s explicit approval for a specific agent.

The new extension is needed because AI-agent security requires both:

  • explicit user consent
  • explicit actor identity

Standard Authorization Code Flow gives you the first, but not the second. Token Exchange gives you pieces of the second, but not the first in the right form. The extension combines them into a model that fits agent systems.

8. The Bigger Security Meaning

At a deeper level, this is not just a protocol convenience. It is a shift in security thinking.

Older OAuth patterns mostly answer the question: can this application access this resource for this user?

Agent-based systems force us to ask a more precise question: which autonomous actor inside the application is acting for the user, and did the user explicitly approve that delegation?

That is a more demanding requirement, but it matches the reality of AI systems. AI agents are not just UI features. They are operational actors. They need explicit identity, explicit delegation, and explicit auditability.

Conclusion

The new OAuth extension for AI agents is needed because AI changes the unit of trust.

Standard Authorization Code Flow assumes the client application is the meaningful actor. Token Exchange assumes delegated authority can be transformed across service boundaries. But AI agents sit between those two models: they need fresh user consent like an interactive client flow, and they need explicit delegation semantics like a multi-hop service flow.

That is why a new extension makes sense. It allows OAuth to move from a world where “an app gets a token for a user” to a world where “a specific agent is delegated limited authority to act for a user, and every party in the system can see and verify that fact.”

Background

In a previous article, I walked through the three most common OAuth 2.0 grant flows: Authorization Code Flow, PKCE Flow, and Device Flow. We looked at which scenarios and application types each one fits, what problems they solve, and how they differ in implementation.

In this post, I will add another important flow: Token Exchange. After reading it, you should have a clearer picture of how token exchange works—and why that understanding pays off when you start thinking about AI Agent authorization. Let’s get started.

## What Is Token Exchange?

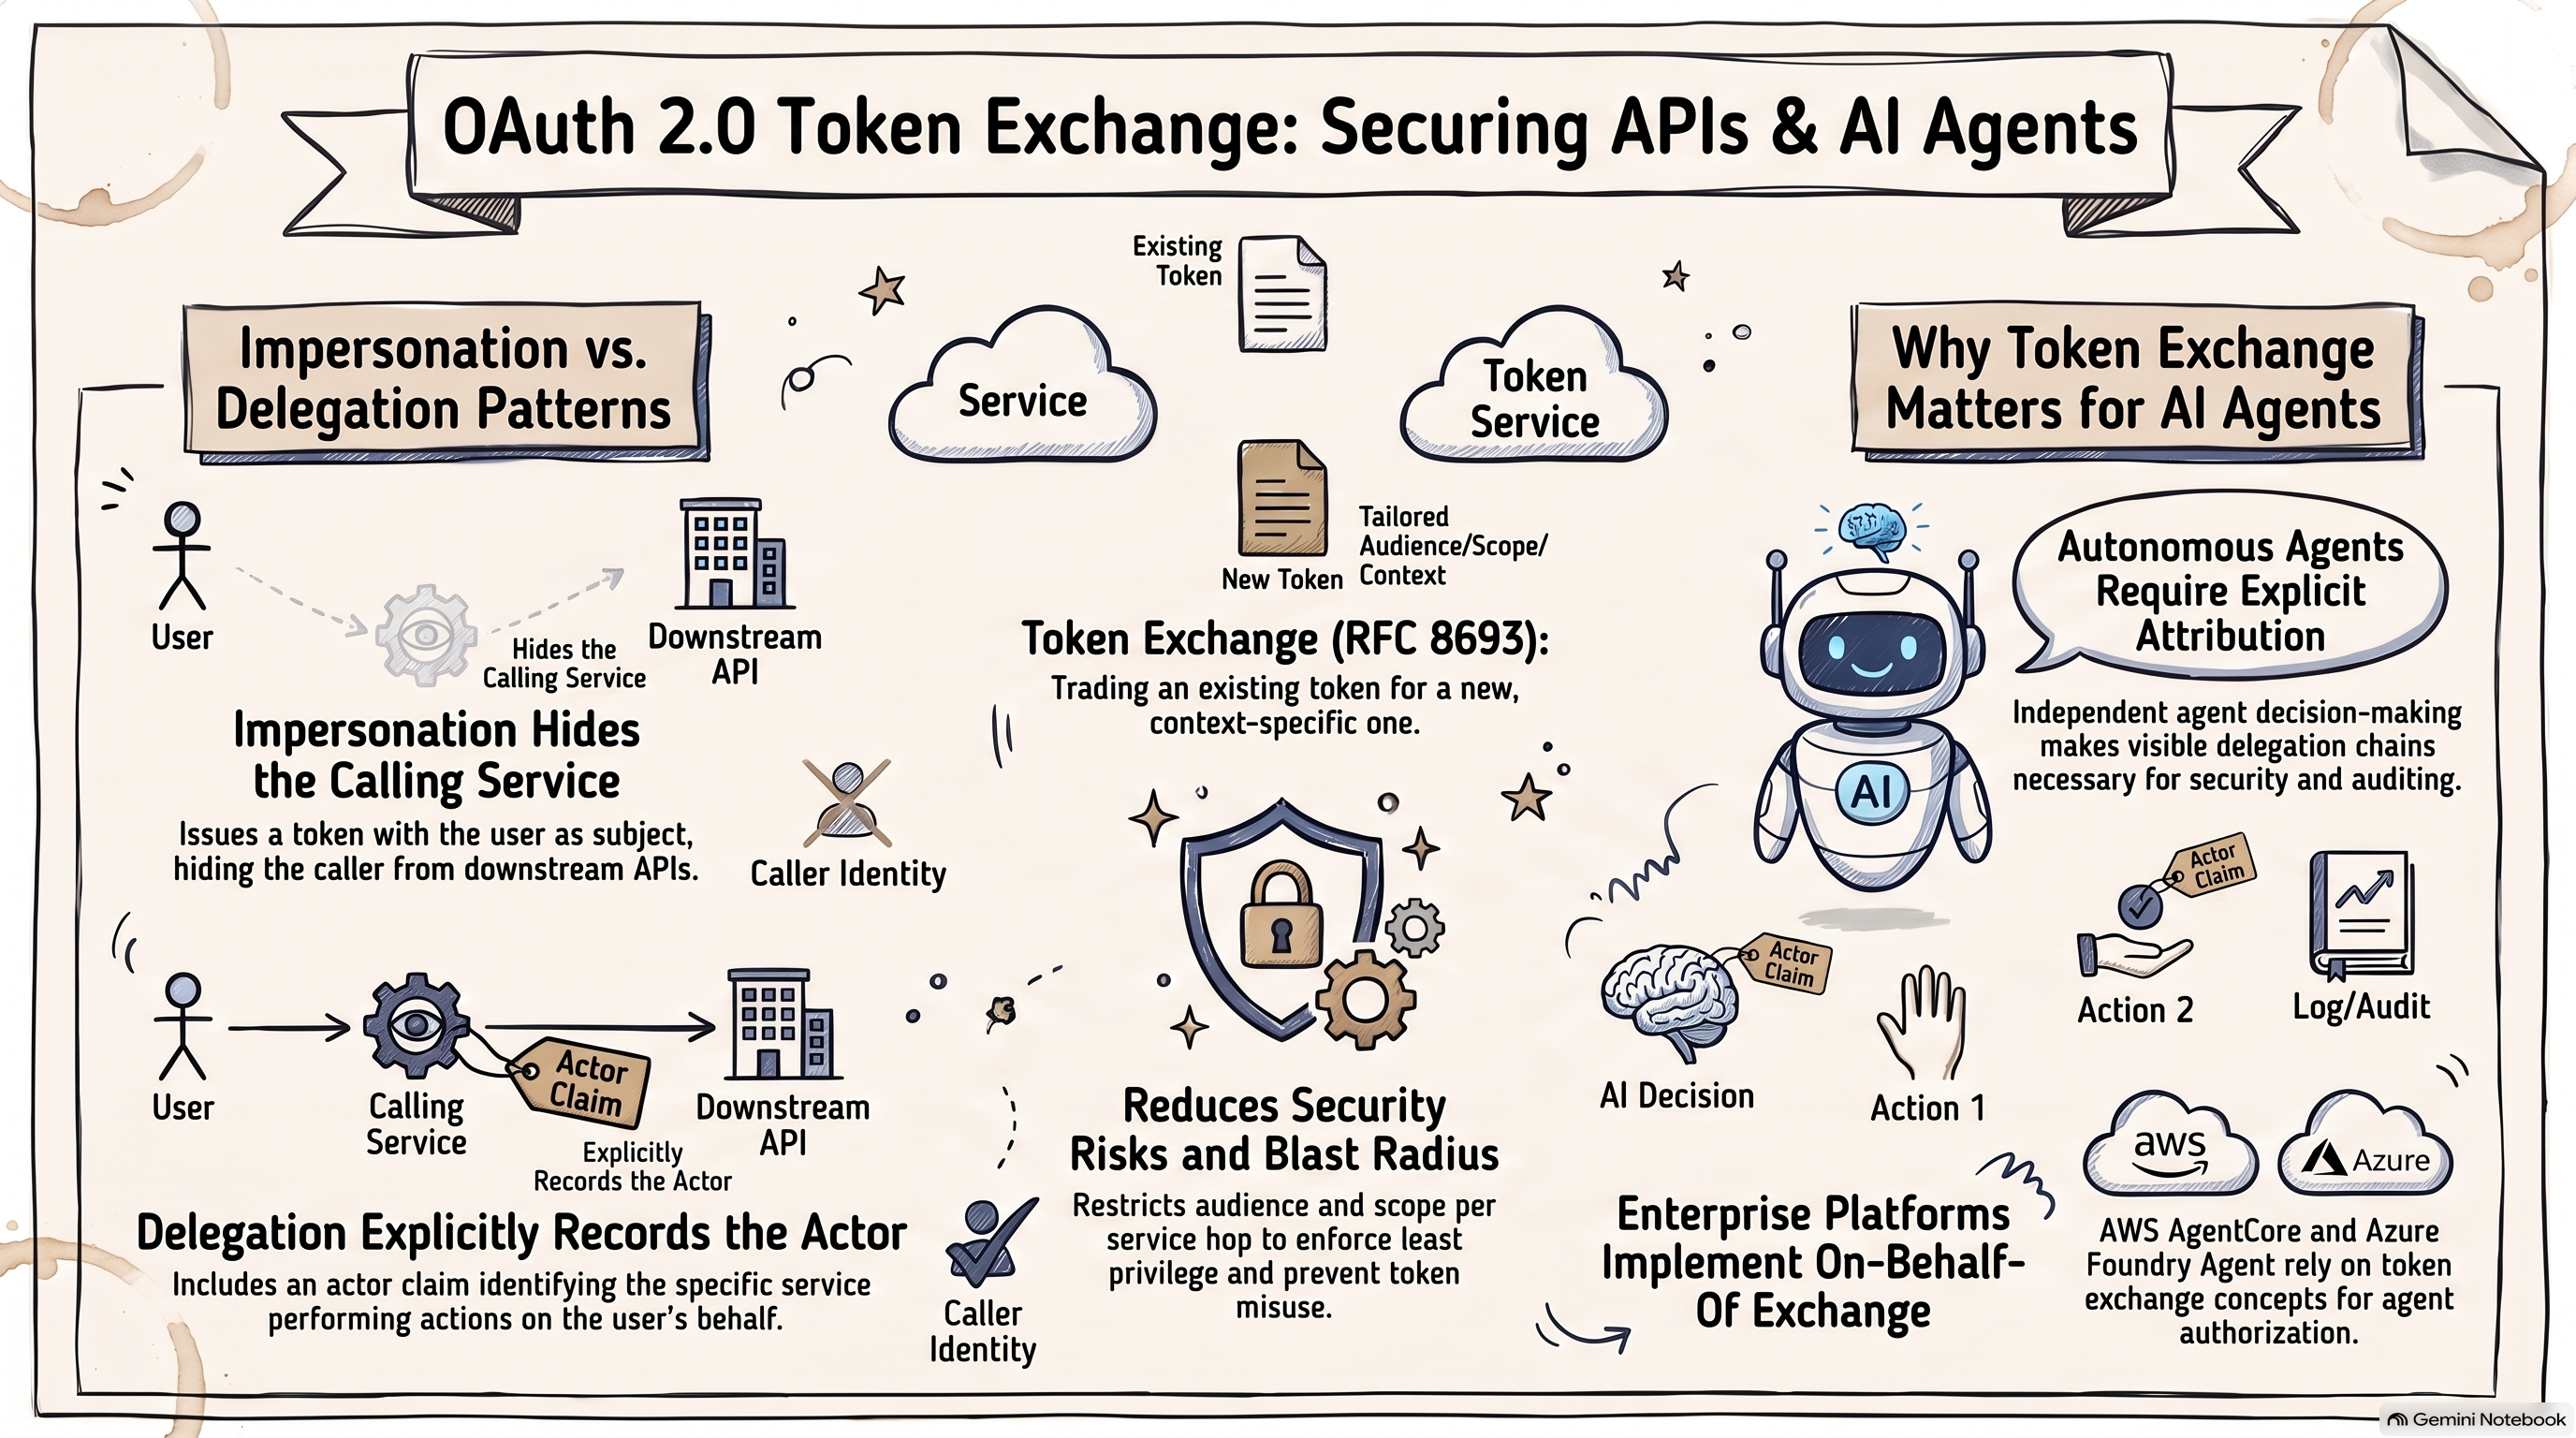
The Token Exchange (RFC 8693) flow is straightforward at a high level: when a client already holds a token, it asks the authorization server (Authorization Server) to issue a new token that is better suited to another service or another security context. You exchange an old token for a new one—hence Token Exchange.

Why Do We Need Token Exchange?

Modern systems are usually made of many services and applications. Token Exchange is especially valuable for service-to-service communication and cross-boundary scenarios. Suppose an upstream API receives the user’s token and then needs to call a downstream API. Instead of forwarding the original user token everywhere, the upstream API can exchange it for a new token that is meant only for the downstream API. That pattern helps in several ways:

  • Matching audience: A user token is often issued for one specific API. The receiver should align with the token’s aud (audience). Otherwise you are accepting a token that was not minted for you—a classic trust boundary problem.
  • Appropriate scope: The original user token may carry permissions intended for the first API. If every downstream API keeps using that same token, they often end up with more authority than they need—the least privilege problem.
  • Explicit actor: User tokens usually do not carry delegation metadata. Downstream services often need to know who delegated access (delegator) and who is actually performing the action (actor).
  • Controlled token forwarding: If every hop only forwards the original user token—for example, browser → API gateway → service A → service B → service C—then any compromise of one service exposes a token that still works elsewhere. That is the blast radius problem.

So the concerns Token Exchange addresses line up closely with how we think about network security:

  • Least privilege: Every component gets only the access it needs.
  • Trust boundary: A token issued for Service A should not be automatically trusted by Service B.
  • Context: Do not only ask “Is this token valid?”—also ask “Valid for whom? For what?”
  • Defense in depth: Even if one token leaks, limit where it can be used.
  • Blast radius reduction: Keep token compromise as local as possible instead of spreading across the whole system.
  • Auditability and attribution: Know who the user is and which service is acting.
  • Explicit delegation: Make delegation visible; do not let one party silently inherit another’s rights.

Unlike other OAuth flows, Token Exchange centers on a concept that matters a lot for AI agents: delegation. That is why I see it as groundwork for agent authorization.

Impersonation vs Delegation

The Token Exchange specification spends considerable effort distinguishing impersonation from delegation. Let’s walk through a concrete example.

Assume this setup:

  • User: Alice
  • Frontend service: orders-web
  • Backend service: inventory-api
  • Authorization server: auth.example.com

Alice uses the frontend. orders-web holds Alice’s token but needs a new token scoped for inventory-api. Token Exchange covers two patterns: impersonation and delegation.

Impersonation

In the impersonation case, orders-web requests a token that lets it act as Alice when calling inventory-api:

1
2
3
4
5
6
7
8
9
POST /token HTTP/1.1
Host: auth.example.com
Content-Type: application/x-www-form-urlencoded
Authorization: Basic b3JkZXJzLXdlYjpzZWNyZXQ=

grant_type=urn:ietf:params:oauth:grant-type:token-exchange&
subject_token=user-access-token&
subject_token_type=urn:ietf:params:oauth:token-type:access_token&
audience=inventory-api

subject_token is the subject’s token—in our story, Alice’s original user token. That identity shows up in the new token’s sub claim. audience is the intended recipient API, here inventory-api.

Key claims in the new token:

1
2
3
4
5
{
"sub": "alice",
"aud": "inventory-api",
"scope": "inventory.read"
}

From inventory-api‘s perspective, the token is about Alice. It has no signal that orders-web is the caller. That is why this pattern is called impersonation.

Delegation

In the delegation case, orders-web sends a slightly richer request:

1
2
3
4
5
6
7
8
9
10
11
POST /token HTTP/1.1
Host: auth.example.com
Content-Type: application/x-www-form-urlencoded
Authorization: Basic b3JkZXJzLXdlYjpzZWNyZXQ=

grant_type=urn:ietf:params:oauth:grant-type:token-exchange&
subject_token=user-access-token&
subject_token_type=urn:ietf:params:oauth:token-type:access_token&
actor_token=orders-web-service-token&
actor_token_type=urn:ietf:params:oauth:token-type:access_token&
audience=inventory-api

Besides subject_token, the client also supplies actor_token—the token for the acting party, orders-web. That relationship appears in the act claim:

1
2
3
4
5
6
7
8
{
"sub": "alice",
"aud": "inventory-api",
"scope": "inventory.read",
"act": {
"sub": "orders-web"
}
}

Now inventory-api can see: the request concerns Alice, and orders-web is the actor performing the call on her behalf. That is delegation.

Great—once delegation is clear, the next question is natural: what does this mean for AI Agent authorization?

AI Agent Scenarios

Compared with traditional apps, AI agents stand out because of autonomy: an agent can decide its own next steps. One client application may host multiple agents, each able to act on its own. For AI agents, an explicit delegation chain is not a nice-to-have—it is often required. That is a big reason many agent authorization designs lean on Token Exchange.

For example, AWS AgentCore and Azure Foundry Agent both support On-Behalf-Of Token Exchange-style authorization. I will dig into how those implementations work in upcoming posts—stay tuned!

Background

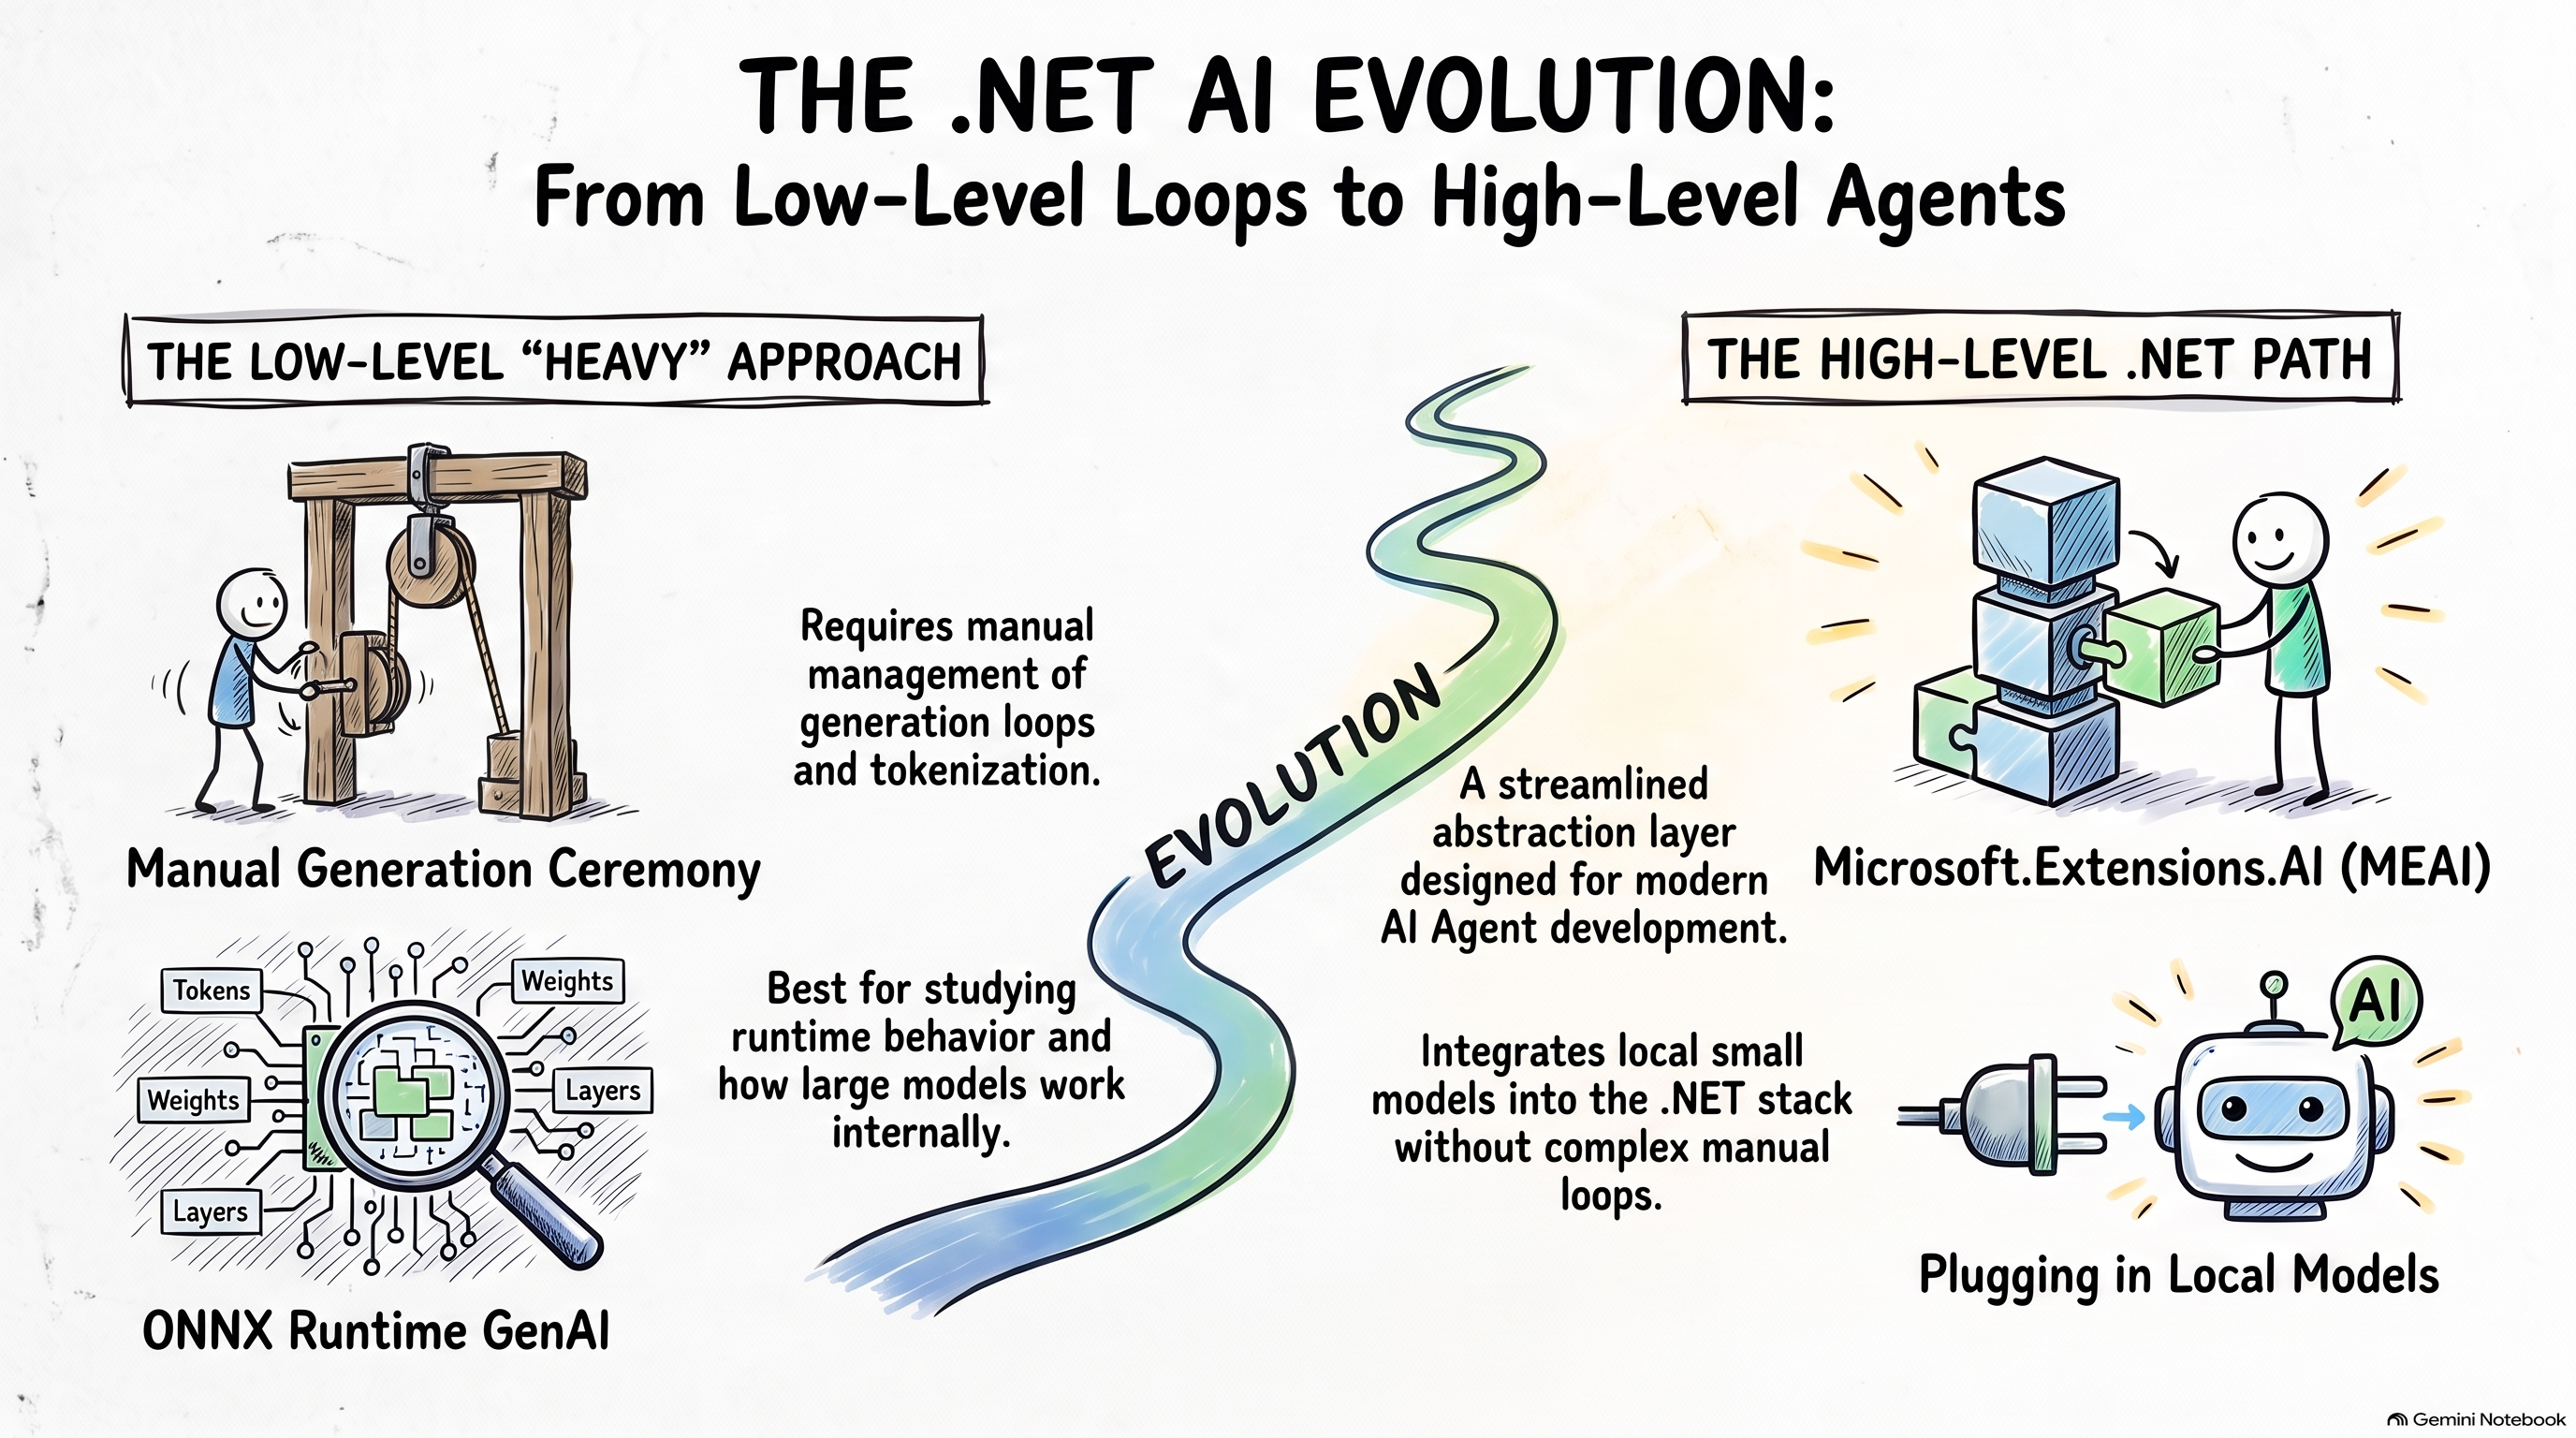
In my previous article, I walked through how to load a small language model locally and build an AI app on top of the cross-platform ONNX model standard. That post focused on the low-level APIs exposed by ONNX Runtime GenAI — great for studying and practicing how large models work under the hood, but a bit too low-level for day-to-day Agent development.

In this article, I will share what I learned about how the .NET ecosystem supports AI Agents today, and how you can plug ONNX into that stack without staying at the Generator / tokenizer loop level. After reading this post, you should understand where Microsoft.Extensions.AI (MEAI) fits, how OnnxRuntimeGenAIChatClient simplifies local chat, and how to take one more step with Microsoft Agent Framework (MAF) for a minimal on-device Agent.

If you have already been through the low-level ONNX GenAI walkthrough, this post is the natural next step. Let’s get started.

## Microsoft.Extensions.AI (MEAI)
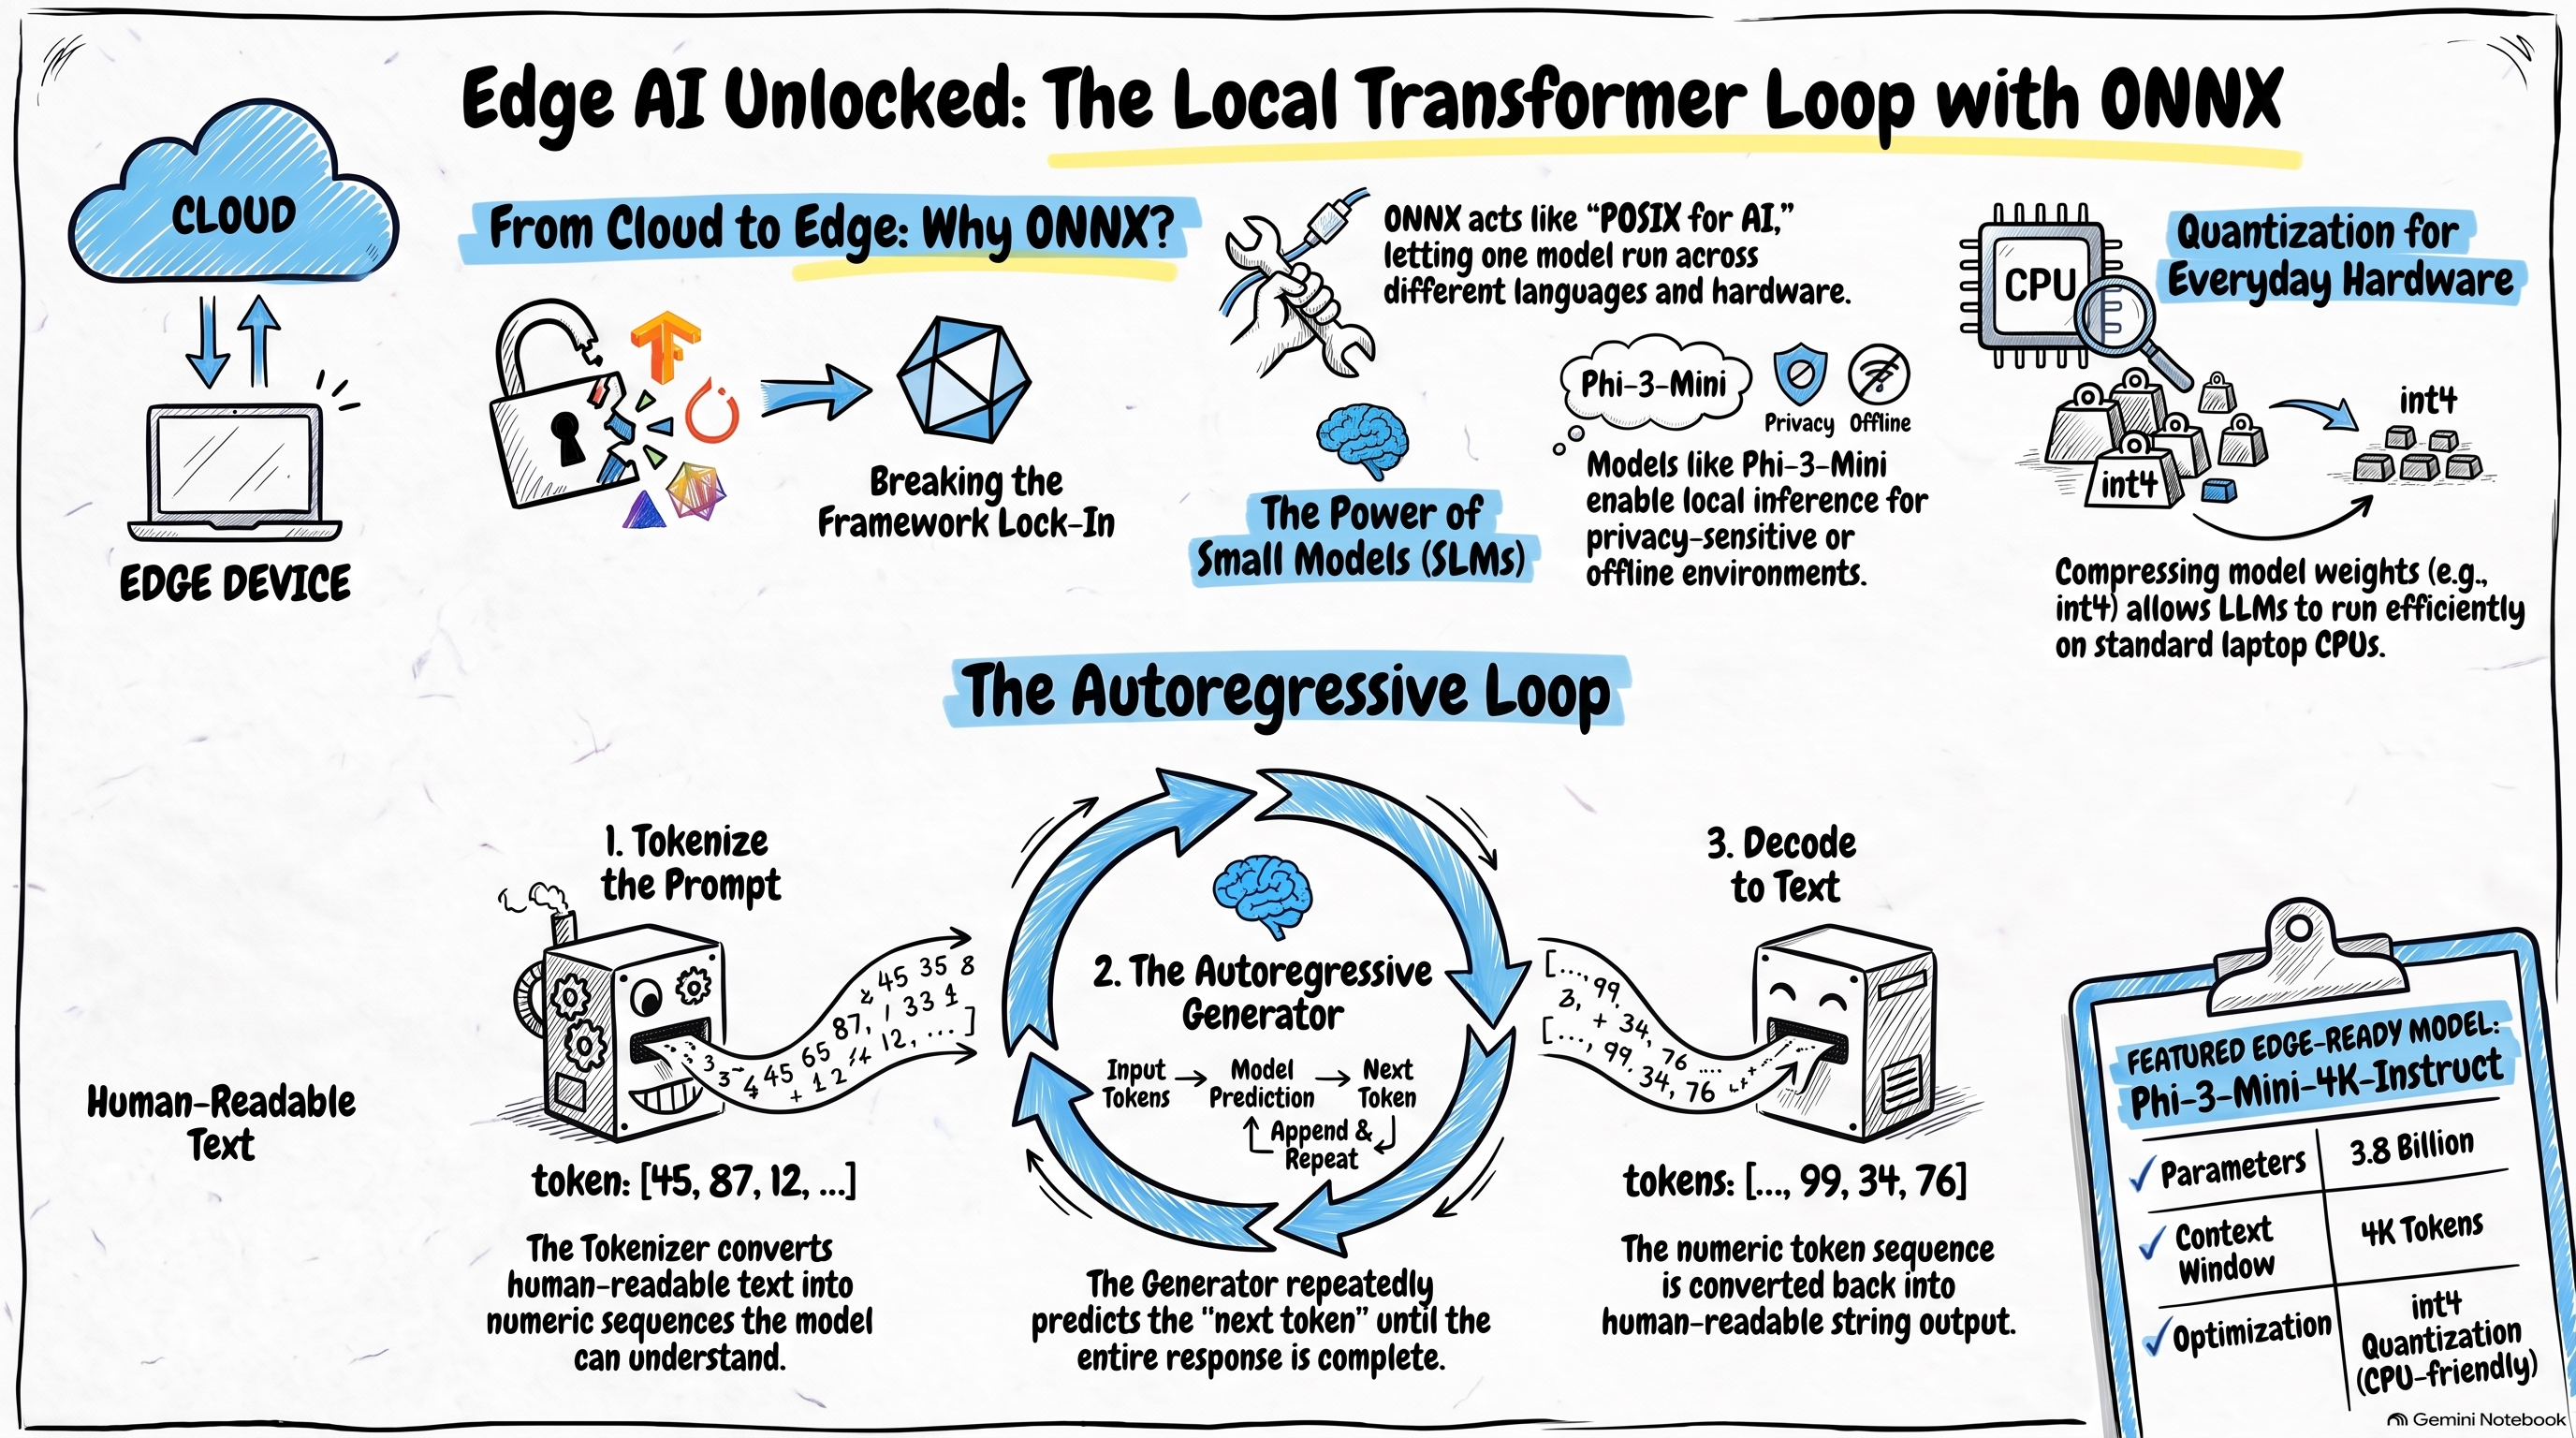
First, the Microsoft.ML.OnnxRuntimeGenAI package exposes a higher-level type: OnnxRuntimeGenAIChatClient. With it, we can talk to a local small model much more easily and skip most of the low-level GenAI API details.

If you look at the implementation, OnnxRuntimeGenAIChatClient is built on the IChatClient interface — and that leads us to an important piece of the .NET AI stack: Microsoft.Extensions.AI (MEAI).

MEAI is a set of core .NET libraries that provide a unified layer of C# abstractions for AI services: small and large language models, embeddings, middleware, and more. Low-level APIs such as IChatClient were extracted from Semantic Kernel and are now part of MEAI. The goal is to act as a unifying layer in the .NET ecosystem so you can pick your preferred frameworks while still sharing the same core concepts across libraries.

Next, let’s see what an app looks like when we combine MEAI with ONNX Runtime GenAI:

1
2
3
4
5
6
7
8
9
10
11
12
13
14
15
16
17
18
19
20
21
22
23
24
25
26
27
28
29
30
using Microsoft.Extensions.AI;
using Microsoft.ML.OnnxRuntimeGenAI;

var modelPath = "path-2-onnx-model";

using var client = new OnnxRuntimeGenAIChatClient(modelPath, new()
{
EnableCaching = false,
});

var messages = new List<ChatMessage>
{
new(ChatRole.System, "You are a helpful AI assistant."),
new(ChatRole.User, "hi"),
};

ChatResponse response = await client.GetResponseAsync(
messages,
new ChatOptions
{
Temperature = 0.7f,
TopP = 0.9f,
AdditionalProperties = new()
{
["num_beams"] = 1,
["do_sample"] = true,
},
});

Console.WriteLine(response.Text);

As you can see, besides OnnxRuntimeGenAIChatClient, we also use types such as ChatMessage and ChatOptions from Microsoft.Extensions.AI. Generation options like num_beams and do_sample can be passed through AdditionalProperties when you need GenAI-specific knobs — handy, right?

One more distinction worth keeping in mind: MEAI alone is not an Agent framework. You can build one-shot calls, chat, or even tool-call loops on top of MEAI without the system becoming fully “agentic.” When you need goal-directed, multi-step orchestration, that is when you reach for Microsoft Agent Framework (MAF) instead.

In the following section, let’s take that next step and wire a local ONNX small model into a minimal edge Agent.

Microsoft Agent Framework (MAF)

The jump from chat client to Agent is surprisingly small: with the AsAIAgent extension on IChatClient, you can promote a chatbot into an AIAgent with instructions and a name.

1
2
3
4
5
6
7
8
9
10
11
12
using Microsoft.Agents.AI;
using Microsoft.Extensions.AI;
using Microsoft.ML.OnnxRuntimeGenAI;

var modelPath = "path-2-onnx-model";

// Get a chat client for ONNX and use it to construct an AIAgent.
using OnnxRuntimeGenAIChatClient chatClient = new(modelPath);
AIAgent agent = chatClient.AsAIAgent(instructions: "You are good at telling jokes.", name: "Joker");

// Invoke the agent and output the text result.
Console.WriteLine(await agent.RunAsync("Tell me a joke about a pirate."));

Same model path, same ONNX runtime underneath — but now you are in MAF’s Agent surface area for orchestration and tooling as your scenarios grow.

Summary

In this post, we connected three layers:

  1. ONNX Runtime GenAI — local inference for small models on device
  2. MEAI (IChatClient, ChatMessage, ChatOptions) — a clean, shared abstraction for model interaction in .NET
  3. MAF (AsAIAgent) — when chat is not enough and you need Agent-style orchestration

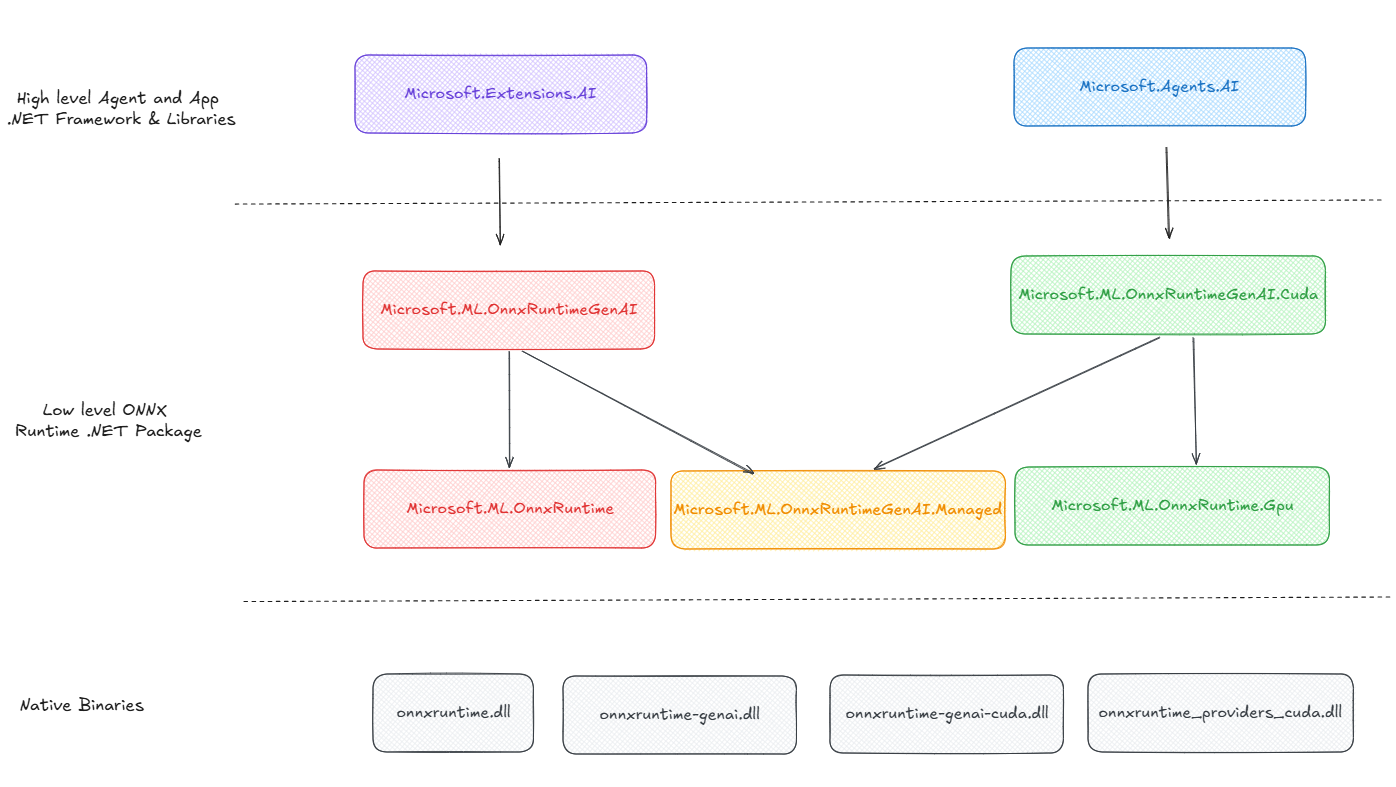
Based on the two examples above, I put together a map of the ONNX-related .NET ecosystem you can refer to when you design your own edge AI or Agent projects:

As we mentioned above, the low-level GenAI APIs are still the best classroom for understanding transformers and autoregressive loops. For product-style Agent work on .NET, this higher-level path is the one I reach for first.

Background

In my previous articles, I have shared quite a bit about RAG systems. One of the most important components in any RAG pipeline is vector storage. High-performance vector databases are usually expensive. But what if you need to store massive amounts of vector data, and latency is not your top priority? Can we find a balance between performance and cost? And if so, what storage option fits that trade-off?

That is exactly where AWS S3 Vector comes in. In this article, I will share what I learned about this service and walk you through a hands-on example.

After reading this post, you should understand how S3 Vector extends the S3 object storage model to vector data, and how to use it in a simple RAG-style workflow.

From S3 to S3 Vector

Characteristics of S3 Object Storage

Among the three major storage types — object storage, block storage, and file storage — S3 is the classic example of object storage. Unlike the other two, S3 stores data as objects inside a flat container (in S3, this container is called a Bucket). Each object contains a key (name), data content, and metadata. The structure looks roughly like this:

1
2
Bucket
└── Object (key → file/blob + metadata)

Because of this design, S3 offers several advantages:

  • Extremely strong scalability
  • Very low cost for massive, infrequently modified data

Of course, it also has limitations, such as:

  • Not ideal for frequent random read/write operations — you work at the whole-object level
  • Relatively higher latency

That is why AWS S3 (or Azure Blob Storage) is a great fit for backups, media files, logs, and other static data scenarios. In more complex architectures, S3 often works alongside high-performance storage services to form a hot/cold multi-tier storage design.

In the AI era, this same pattern naturally extends to vector storage.

How S3 Vector Extends S3

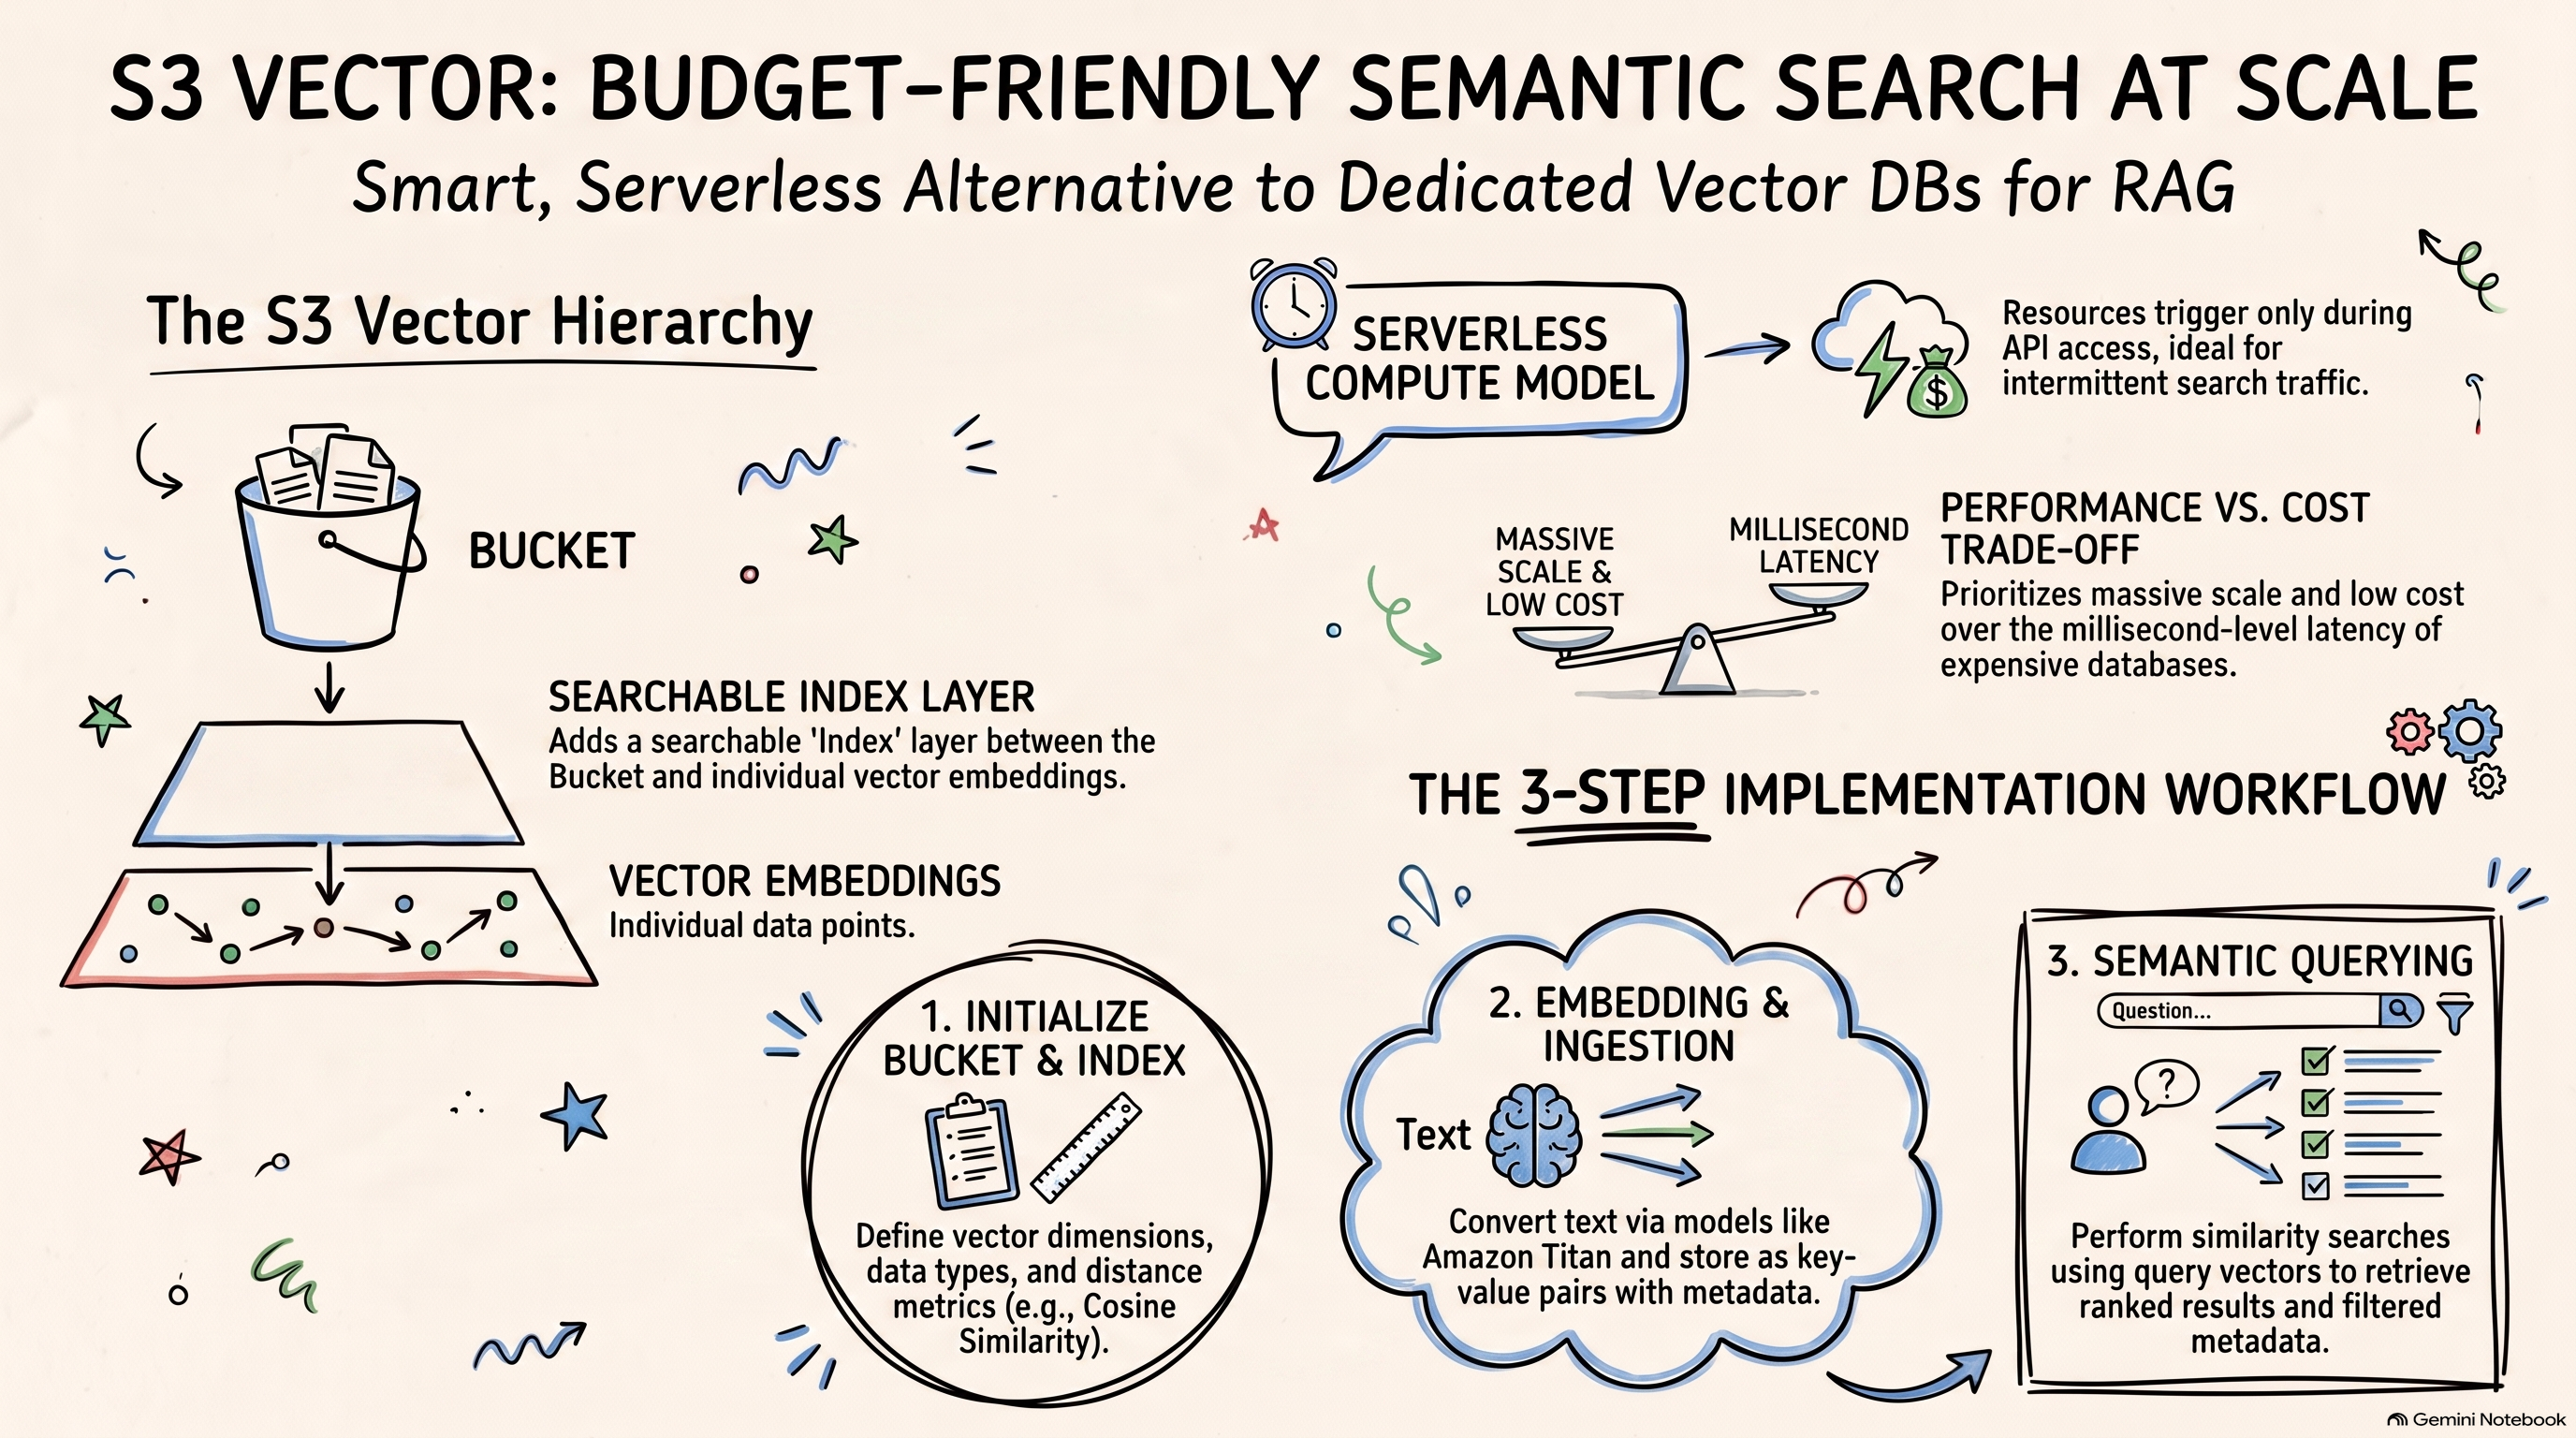
From a product positioning perspective, S3 Vector solves the same problem that S3 solved in the traditional cloud era: store more data at a lower cost. The difference is that the data being stored is vector data.

Of course, you could store raw semantic vectors directly in a classic S3 Bucket. But for AI applications, raw vector data alone is not very useful. What we actually need is similarity search over vectors — the foundation for building Agents or RAG systems.

So S3 Vector keeps the familiar Bucket concept and introduces a new storage structure on top of it:

1
2
3
Vector bucket
└── Vector index
└── Vector (key → embedding + metadata)

The key difference is that S3 Vector introduces an index layer, where embeddings and metadata are stored as key-value pairs.

You can still read an embedding by key, but in real AI applications, what you usually need is to search for information that is semantically closest to a query.

That is the biggest difference from a classic S3 Bucket. Beyond storage, S3 Vector also manages underlying compute resources in a Serverless way. When a user query comes in, the service performs the search for you.

This Serverless, pay-as-you-go compute model means resources are triggered only when APIs are accessed — not kept running while idle. That keeps compute costs as low as possible.

Smart design, right? It is a strong fit for scenarios with massive vector storage, moderate access volume, and relaxed latency requirements — very much aligned with the design philosophy of object storage.

Next, let’s walk through a simple example to see how S3 Vector works in practice.

Demo

Create a Vector Bucket

As you can see, S3 Vector has its own dedicated client:

1
2
3
4
5
6
7
8
9
10
11
import boto3

session = boto3.Session()
region = session.region_name

# Create a S3 Vectors client in the AWS Region of your choice.
s3vectors = boto3.client("s3vectors", region_name=region)
bedrock = boto3.client("bedrock-runtime", region_name=region)

# Create a vector bucket
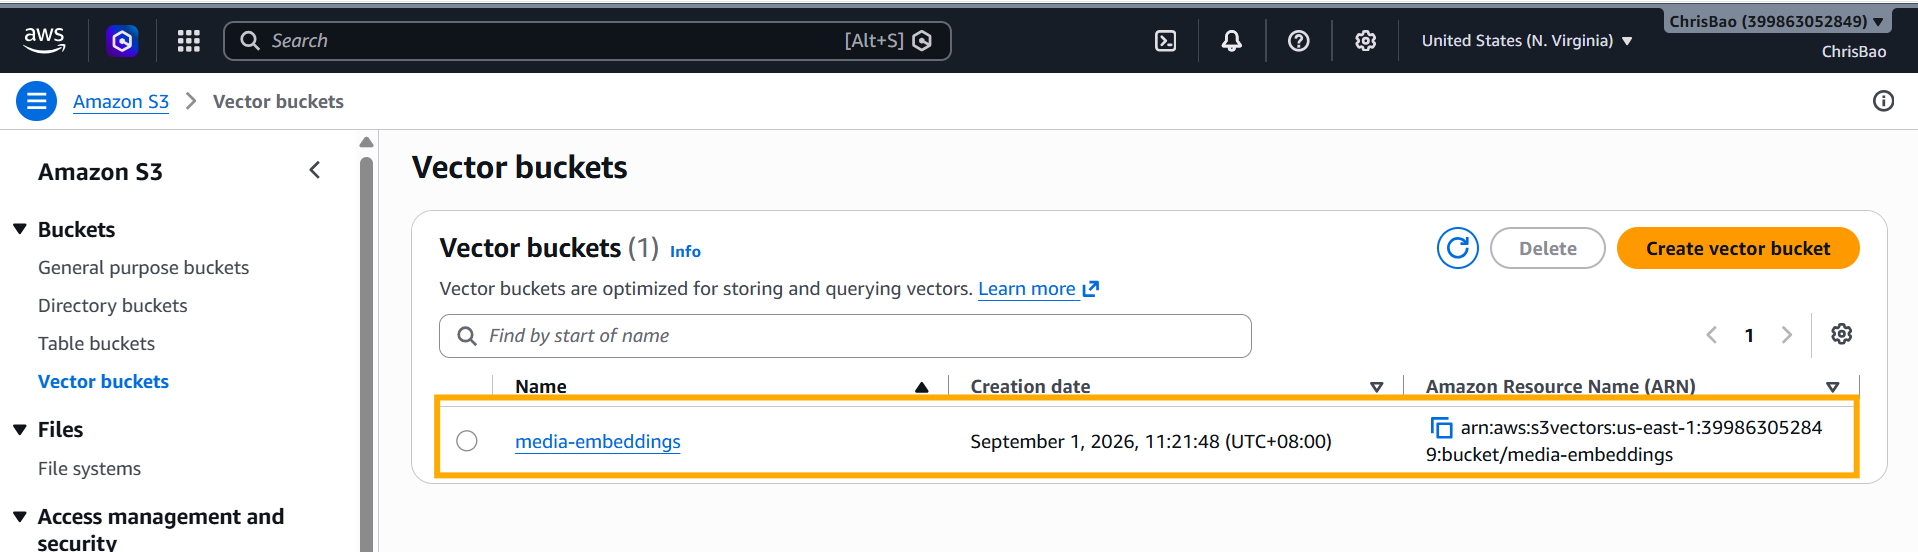
s3vectors.create_vector_bucket(vectorBucketName="media-embeddings")

The created Vector Bucket looks like this:

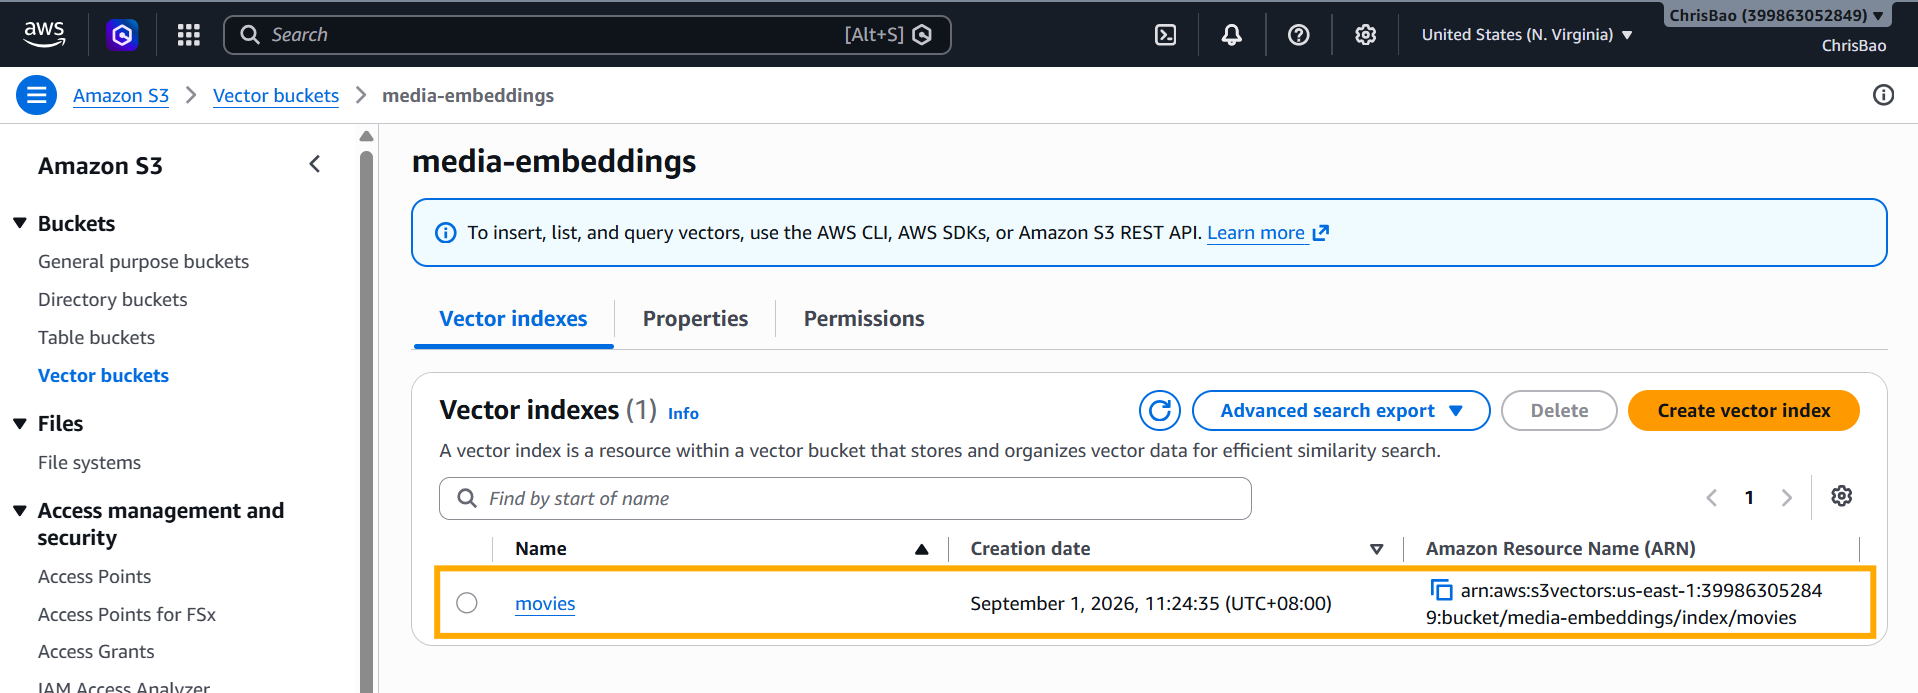
Create a Vector Index

Next, let’s create a Vector Index inside the Vector Bucket:

1
2
3
4
5
6
7
8
9
# Create a vector index "movies" in the vector bucket "media-embeddings" with non-filterable metadata keys
s3vectors.create_index(
vectorBucketName="media-embeddings",
indexName="movies",
dimension=1024,
distanceMetric="cosine",
dataType="float32",
metadataConfiguration={"nonFilterableMetadataKeys": ["source_text"]}
)
  • dimension and dataType define the vector dimension and numeric type. These must match the embedding model you use later.
  • distanceMetric defines how vector distance is calculated. Since we are working with plain text in this article, cosine is a good choice.
  • metadataConfiguration controls metadata behavior. By default, metadata fields support filtering. But some fields are not ideal for filtering — for example, the original source text. That field is mainly there to provide context so you know what the search result actually is. So we mark source_text as non-filterable.

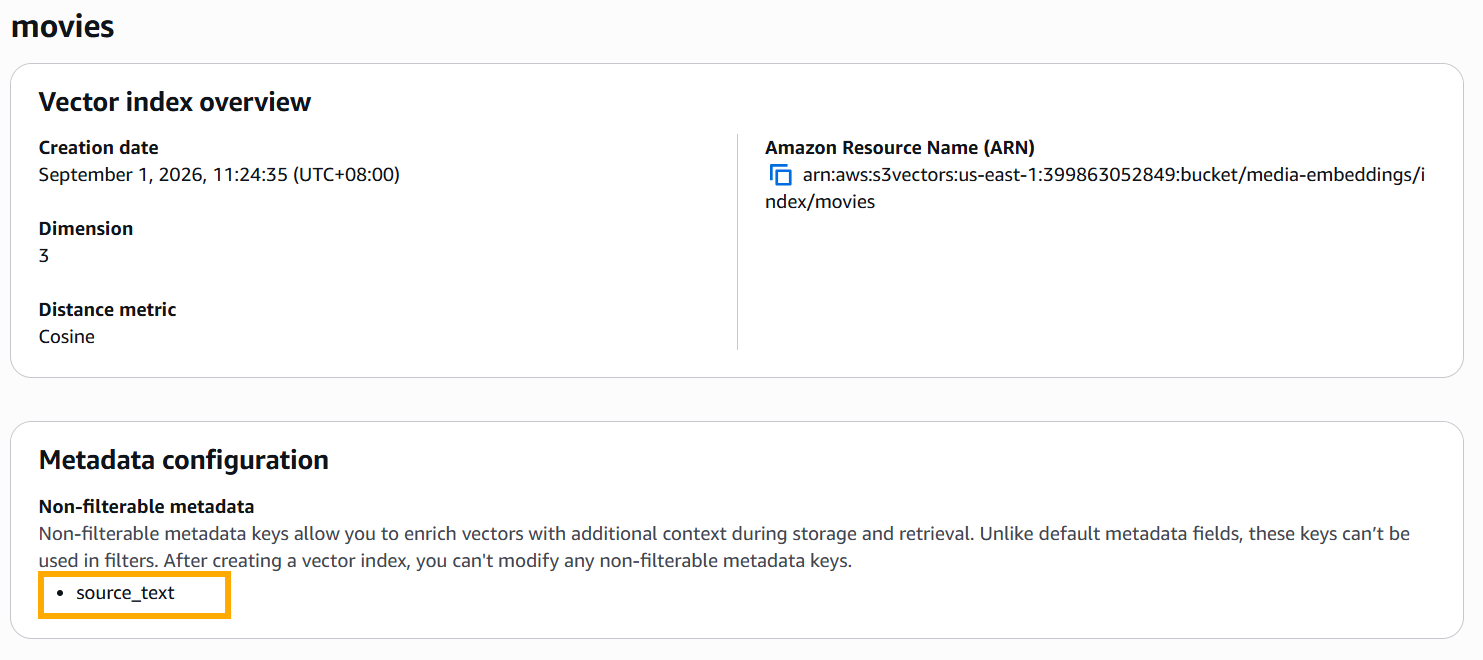
The Vector Index details look like this:

Embedding and Data Ingestion

Now we can ingest data. First, we choose amazon.titan-embed-text-v2:0 as our embedding model.

Then we call put_vectors to write embedding data into the index:

1
2
3
4
5
6
7
8
9
10
11
12
13
14
15
16
17
18
19
20
21
22
23
24
25
26
27
28
29
30
31
32
33
34
35
36
37
38
39
40
41
42
43
import json

# Texts to convert to embeddings.
texts = [
"Star Wars: A farm boy joins rebels to fight an evil empire in space",
"Jurassic Park: Scientists create dinosaurs in a theme park that goes wrong",
"Finding Nemo: A father fish searches the ocean to find his lost son"
]

# Generate vector embeddings.
embeddings = []
for text in texts:
response = bedrock.invoke_model(
modelId="amazon.titan-embed-text-v2:0",
body=json.dumps({"inputText": text})
)

# Extract embedding from response.
response_body = json.loads(response["body"].read())
embeddings.append(response_body["embedding"])

# Write embeddings into vector index with metadata.
s3vectors.put_vectors(
vectorBucketName="media-embeddings",
indexName="movies",
vectors=[
{
"key": "Star Wars",
"data": {"float32": embeddings[0]},
"metadata": {"source_text": texts[0], "genre": "scifi"}
},
{
"key": "Jurassic Park",
"data": {"float32": embeddings[1]},
"metadata": {"source_text": texts[1], "genre": "scifi"}
},
{
"key": "Finding Nemo",
"data": {"float32": embeddings[2]},
"metadata": {"source_text": texts[2], "genre": "family"}
}
]
)

Pay attention to the structure of each vector entry:

1
2
3
4
5
{
"key": "xxxx",
"data": {"float32": [0.12, -0.34, ...]},
"metadata": {"source_text": "xxxx", "genre": "xxx"}
}

Notice that float32 matches the type we defined when creating the index. The source_text field will not support filtering, while other metadata fields will.

As mentioned above, S3 Vector is more often used for similarity search via query_vectors, rather than reading an embedding by key.

1
2
3
4
5
6
7
8
9
10
11
12
13
14
15
16
17
18
19
20
21
22
23
24
25
# Query text to convert to an embedding.
input_text = "adventures in space"

# Generate the vector embedding.
response = bedrock.invoke_model(
modelId="amazon.titan-embed-text-v2:0",
body=json.dumps({"inputText": input_text})
)

# Extract embedding from response.
model_response = json.loads(response["body"].read())
embedding = model_response["embedding"]

# Query vector index with a metadata filter.
response = s3vectors.query_vectors(
vectorBucketName="media-embeddings",
indexName="movies",
queryVector={"float32": embedding},
topK=3,
filter={"genre": "scifi"},
returnDistance=True,
returnMetadata=True
)

print(json.dumps(response["vectors"], indent=2))

We also added a metadata filter on the genre field. The final result looks like this:

1
2
3
4
5
6
7
8
9
10
11
12
13
14
15
16
17
18
[
{
"distance": 0.7918924689292908,
"key": "Star Wars",
"metadata": {
"source_text": "Star Wars: A farm boy joins rebels to fight an evil empire in space",
"genre": "scifi"
}
},
{
"distance": 0.8599859476089478,
"key": "Jurassic Park",
"metadata": {
"genre": "scifi",
"source_text": "Jurassic Park: Scientists create dinosaurs in a theme park that goes wrong"
}
}
]

Great, right? With just a few API calls, we get semantic search plus metadata filtering — a practical building block for cost-sensitive RAG systems.

Summary

S3 Vector combines S3’s low-cost storage with Serverless vector search. It is a strong option for building cost-sensitive RAG systems — especially when you have large volumes of vector data, moderate query traffic, and relaxed latency requirements.

As I mentioned in my previous RAG articles, choosing the right vector store is always a trade-off. If your workload does not need millisecond-level retrieval on every query, S3 Vector is worth a closer look.

Background

If you have been reading my articles for a while, you probably know that I have focused mainly on Azure and AWS cloud AI services and applications. In this post, I want to step outside that comfort zone and introduce a different direction: edge AI.

In this article, I will share what I learned about ONNX (Open Neural Network Exchange) — an open standard and file format that helps AI models run across platforms. We will look at the problem it solves, the convenience it brings to AI/ML applications, and how this capability extends in the GenAI era to make local small-model deployment and inference much easier.

If those questions interest you, let’s get started.

ONNX: Cross-Platform AI Models

What Problem Does ONNX Solve?

What problem is ONNX trying to solve? Let me explain with a story from my own experience.

At a previous employer, we built a real-time computing system as a cloud service on the .NET stack. Due to business requirements, we needed to explore deploying machine learning models on that system and serving online inference. Before that, the system had no ML requirements or capabilities at all — it was a fairly ordinary .NET backend microservices stack.

To add ML inference, I researched several approaches:

Dedicated model inference services: Platforms like Azure Machine Learning or AWS SageMaker can host models for online inference, and our system would communicate with them over the network. This approach requires significant infrastructure investment, and network calls also add latency.

Embedded ML frameworks: We could integrate frameworks like PyTorch or TensorFlow directly into our system, embed models in-process, avoid extra infrastructure and operations, and skip network calls at inference time — all good for performance. But this approach locks you into a specific framework and reduces flexibility.

As you can see, each approach has trade-offs. Wouldn’t it be great if one solution combined the strengths of both while avoiding their weaknesses? That is exactly what ONNX does.

ONNX

ONNX (Open Neural Network Exchange) is an open standard that defines a common format for machine learning models, enabling cross-platform deployment. You can think of it as the AI equivalent of POSIX (Portable Operating System Interface) — a standard that lets different UNIX/Linux kernels interoperate.

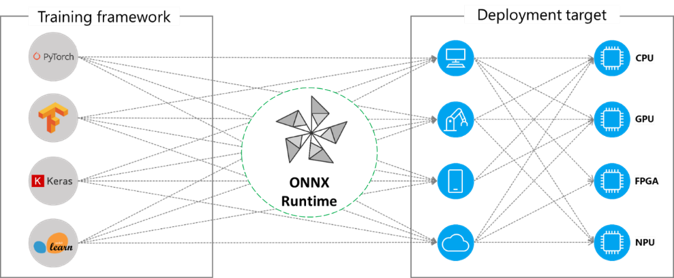
Today, ONNX is supported by major ML frameworks and vendors.

ONNX & ONNX Runtime

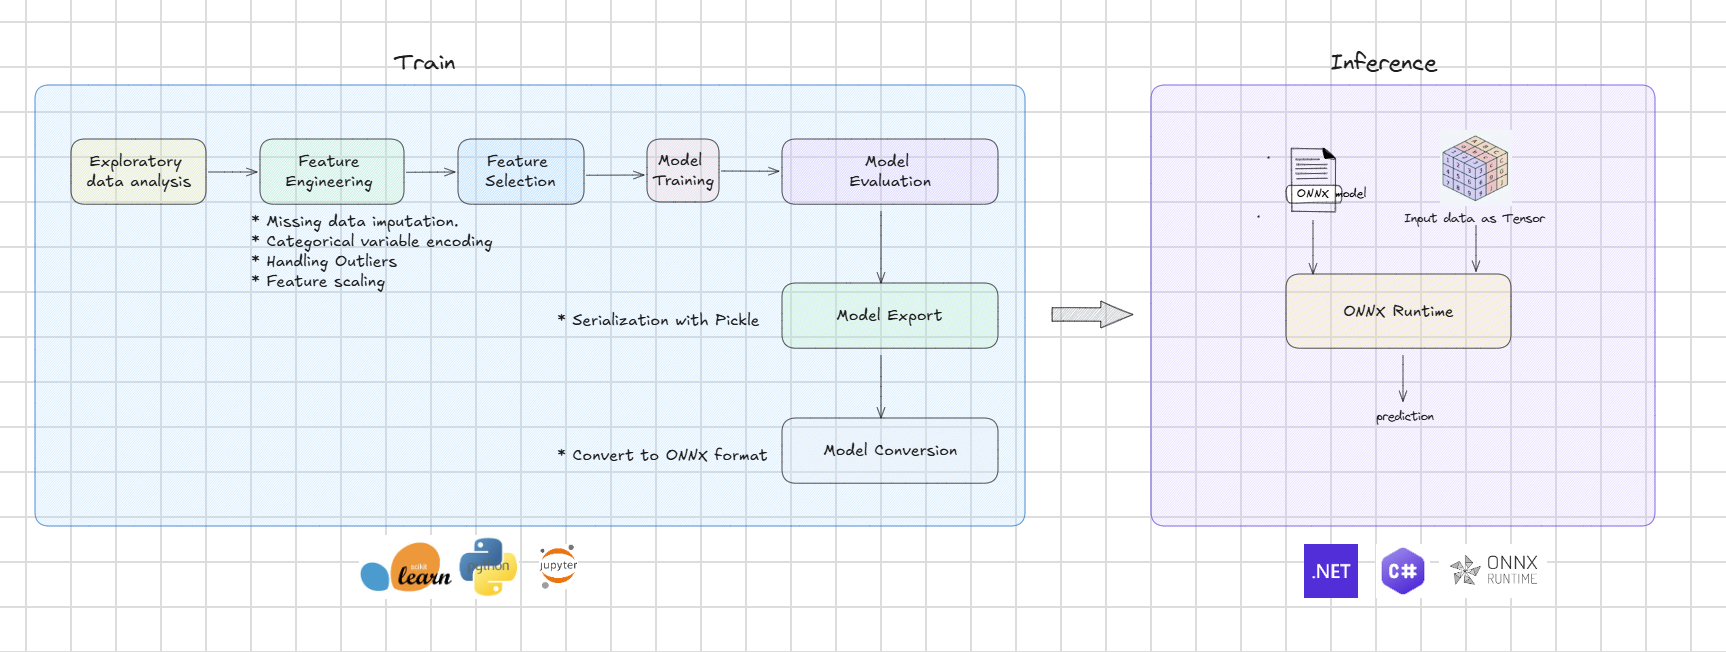
With ONNX, the ML training and deployment workflow naturally splits into two phases:

Training phase: ONNX defines the model standard, and mainstream ML frameworks provide tools to convert models into ONNX format. In the example below, the scikit-learn framework uses the skl2onnx library to perform the conversion.

1
2
3
4
5
6
# Convert into ONNX format.
from skl2onnx import to_onnx

onx = to_onnx(clr, X[:1])
with open("rf_iris.onnx", "wb") as f:
f.write(onx.SerializeToString())

Inference phase: Another key component is ONNX Runtime — the runtime engine that executes models. ONNX Runtime is a native C++ library with binding APIs for different stacks, such as C# and Python.

In addition, ONNX Runtime provides different libraries for different hardware — CPU, GPU, and more. In this article, we will default to CPU. In a future post, I will dig into how to improve efficiency with GPU.

The most basic inference flow looks like this. This example uses .NET and C#, based on the Microsoft.ML.OnnxRuntime NuGet package.

1
2
3
4
5
6
7
8
9
10
11
12
13
14
using Microsoft.ML.OnnxRuntime;
using Microsoft.ML.OnnxRuntime.Tensors;

// 1. Create an inference session
session = new InferenceSession(onnxModelPath)

// 2. Build tensor from features
var inputTensor = new DenseTensor<float>(data, shape);

// 3. Wrap for ONNX Runtime (legacy API)
var featuers_input = NamedOnnxValue.CreateFromTensor<float>("feature_input", inputTensor);

// 4. Run model
session.Run(features_input);

Using ONNX for traditional ML models is not the main focus of this article. Next, let’s look at what opportunities ONNX opens up in the GenAI era.

ONNX Runtime GenAI: Evolution in the LLM Era

In the GenAI era, ONNX Runtime has a dedicated extension: ONNX Runtime GenAI. It follows the same philosophy as ONNX Runtime — letting applications embed and load models directly.

In theory, that means large models too. But frontier models today sit in the hundreds of billions or trillions of parameters. In practice, no application can realistically embed those locally.

We can, however, push the idea to the other extreme: small models!

Because they do not depend on cloud resources, small models fit many scenarios: limited network connectivity, strict data privacy and compliance, and lower accuracy requirements but higher latency sensitivity, among others.

So ONNX Runtime GenAI is a strong platform for edge AI built on small models!

In the demo below, let’s try it hands-on.

Demo: Local Small Models with ONNX

Phi-3-Mini-4K-Instruct ONNX Model

In this article, we use Microsoft’s Phi family small model: Phi-3-Mini-4K-Instruct.

Phi-3-Mini-4K-Instruct is an instruction-tuned variant built on top of Phi-3-Mini-4K — a model better aligned with how users interact with chat systems. It has 3.8B parameters and a 4K context window.

The model ships in variants for different compute targets: cuda, directml, and cpu_and_mobile.

Today we use the cpu_and_mobile variant. It is quantized, with weights compressed to int4, which makes it friendly for ordinary PCs, mobile devices, and edge hardware.

Building a Transformer Workflow with ONNX Runtime GenAI

When you call large models on cloud platforms like Azure Foundry or AWS Bedrock, you usually just specify the model name. Some platforms expose a few Transformer parameters — temperature, top_k, top_p, and so on — so you can shape model behavior at a basic level.

ONNX Runtime GenAI is a relatively low-level engine. You need to assemble the Transformer workflow yourself through its APIs.

On one hand, that is a real challenge. On the other hand, it is an excellent way to learn and practice Transformer fundamentals hands-on. In the sections below, let’s see how to build that workflow with ONNX Runtime GenAI.

The code examples use C# and .NET.

Creating the Tokenizer

The basic unit of information for large language models is the token, so the first step is to create a Tokenizer.

1
2
3
4
5
6
using Microsoft.ML.OnnxRuntimeGenAI;

var tokenizer = new Tokenizer(model);
var tokenizerStream = tokenizer.CreateStream();

Console.WriteLine("Tokenizer created");

Later, we will see how this Tokenizer converts the user’s prompt into tokens.

Creating the Model

Next, we create the model.

1
2
3
4
5
6
using Microsoft.ML.OnnxRuntimeGenAI;

var path = "pathtoonnxmodel"
var config = new Config(path);
var model = new Model(config);
Console.WriteLine("Model loaded");

Pass the model directory path to the engine. It automatically loads the ONNX Runtime GenAI configuration file: genai_config.json. For the Phi-3-Mini-4K-Instruct model we use here, the file looks like this:

1
2
3
4
5
6
7
8
9
10
11
12
13
14
15
16
17
18
19
20
21
22
23
24
25
26
27
28
29
30
31
32
33
34
35
36
37
38
39
40
41
42
43
44
45
46
47
48
49
50
51
52
53
{
"model": {
"bos_token_id": 1,
"context_length": 4096,
"decoder": {
"session_options": {
"log_id": "onnxruntime-genai",
"provider_options": []
},
"filename": "phi3-mini-4k-instruct-cpu-int4-rtn-block-32-acc-level-4.onnx",
"head_size": 96,
"hidden_size": 3072,
"inputs": {
"input_ids": "input_ids",
"attention_mask": "attention_mask",
"past_key_names": "past_key_values.%d.key",
"past_value_names": "past_key_values.%d.value"
},
"outputs": {
"logits": "logits",
"present_key_names": "present.%d.key",
"present_value_names": "present.%d.value"
},
"num_attention_heads": 32,
"num_hidden_layers": 32,
"num_key_value_heads": 32
},
"eos_token_id": [
32000,
32001,
32007
],
"pad_token_id": 32000,
"type": "phi3",
"vocab_size": 32064
},
"search": {
"diversity_penalty": 0.0,
"do_sample": false,
"early_stopping": true,
"length_penalty": 1.0,
"max_length": 4096,
"min_length": 0,
"no_repeat_ngram_size": 0,
"num_beams": 1,
"num_return_sequences": 1,
"past_present_share_buffer": true,
"repetition_penalty": 1.0,
"temperature": 1.0,
"top_k": 1,
"top_p": 1.0
}
}

Beyond basic model metadata, the search section defines many parameters that affect Transformer inference behavior. We cannot cover all of them in this article, but keep in mind they are adjustable. Try changing them and observe the differences — that is one of the best ways to build intuition for how models behave. I will share more on this topic in a future post.

Configuring the Generator

Next we need a Generator. This is not a theoretical Transformer concept — it is a key engine component that orchestrates the entire workflow.

Transformer models use an autoregressive mechanism: generate one token at a time, then predict the next token based on the prompt and all tokens generated so far — forming a loop. The Generator controls that loop.

When you create the Generator, you can tune the parameters mentioned above to control model behavior:

1
2
3
4
using Microsoft.ML.OnnxRuntimeGenAI;

var generatorParams = new GeneratorParams(model);
var generator = new Generator(model, generatorParams);

Now let’s look at that loop.

Token Generation Loop
1
2
3
4
5
6
7
8
9
10
11
12
13
14
15
16
17
18
19
20
21
22
23
24
25
using Microsoft.ML.OnnxRuntimeGenAI;

// Get input tokens
string user_prompt = "hello";
string prompt = $@"[{{""role"":""system"",""content"":""{systemPrompt}""}},{{""role"":""user"",""content"":""{user_prompt}""}}]";
var sequences = tokenizer.Encode(prompt);

// append input tokens to generator
generator.AppendTokenSequences(sequences);

// Run generation loop
while (true)
{
generator.GenerateNextToken();
if (generator.IsDone())
break;
}

// Get output tokens and decode to string
var outputSequence = generator.GetSequence(0);
var outputString = tokenizer.Decode(outputSequence);

// Display output
Console.WriteLine("Output:");
Console.WriteLine(outputString);

From the code above, the flow breaks down into these steps:

  • Use the Tokenizer to convert the user prompt into a token sequence
  • Pass the token sequence to the Generator
  • The Generator produces the next token one at a time until completion
  • Read the full sequence from the Generator
  • Use the Tokenizer to decode the token sequence back into a string

This code is a clear, hands-on illustration of how Transformer inference works in practice. It is worth reading carefully more than once.

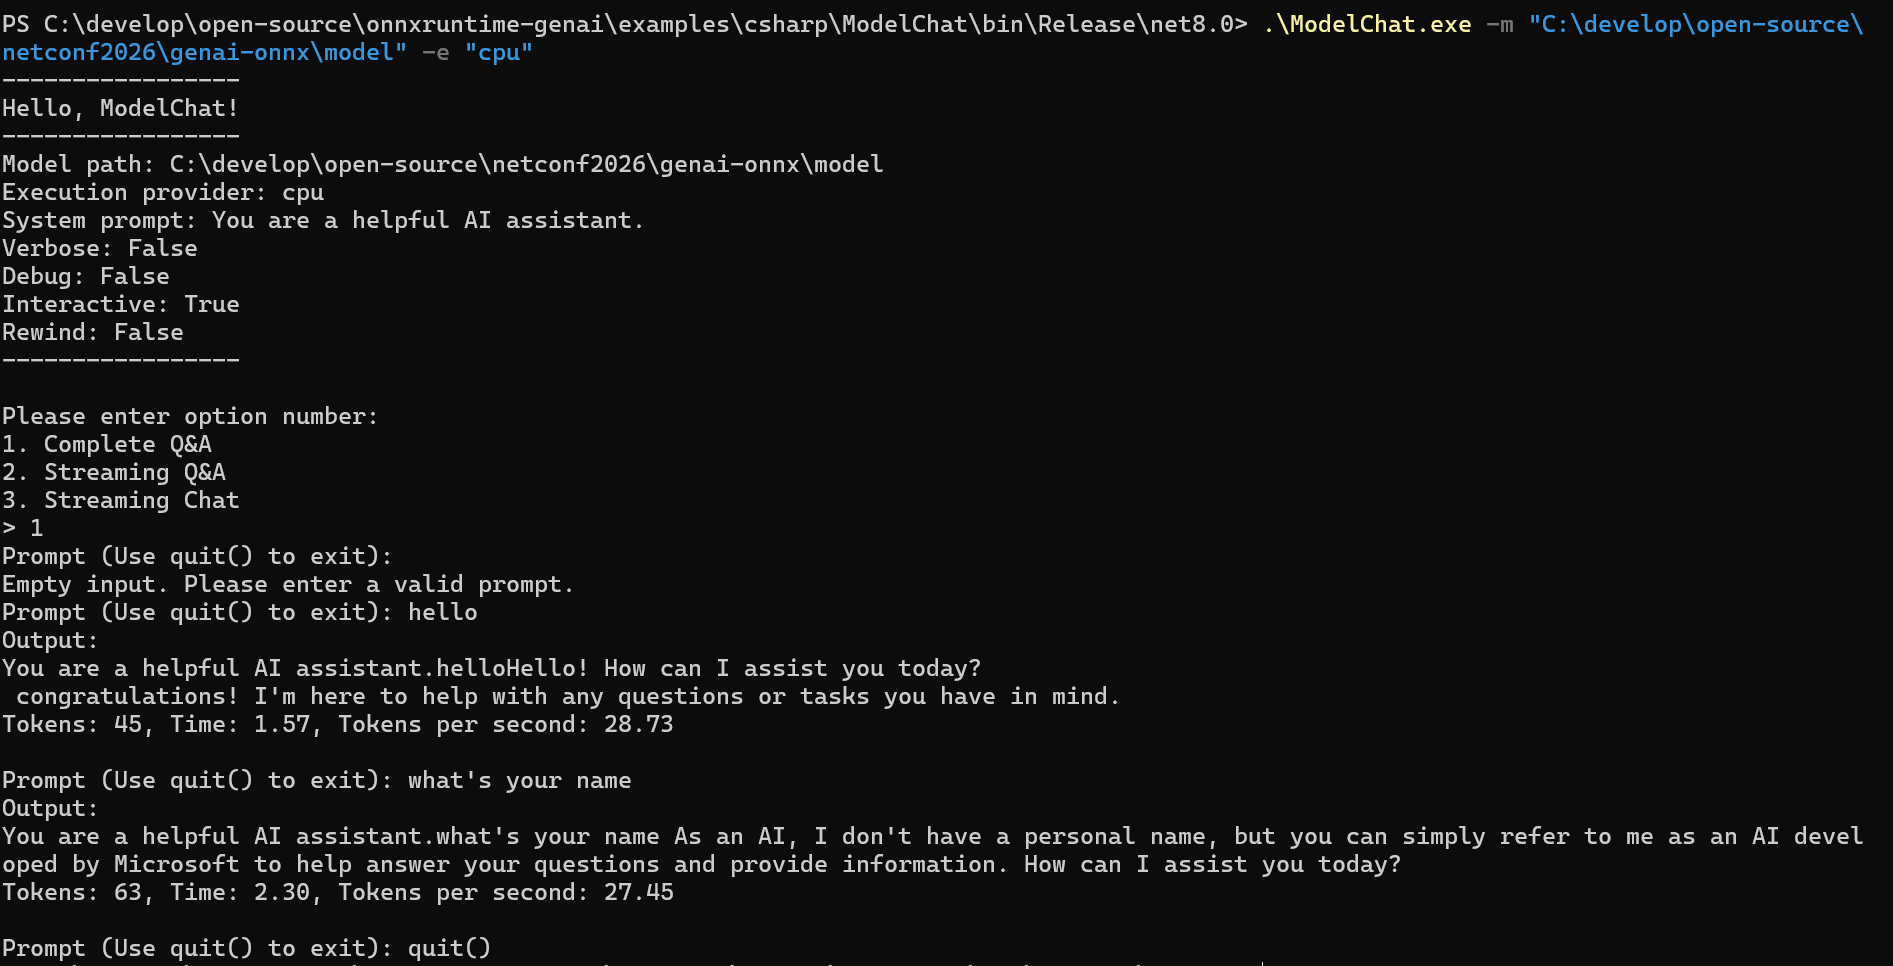
Build and run it, and you will see a small model answering your questions locally on ordinary CPU hardware. Great, right?

Introduction

In this article, I will share what I learned about .NET memory management by troubleshooting a memory leak issue for a .NET service running in a real production environment. After reading this post, you can understand more about the following items:

  • .NET Memory Management and .NET Garbage Collection
  • Diagnose memory usage with WinDbg

Previously I once published articles about memory allocation of native applications written in C on Linux systems. I highly recommend you read both articles and compare what’s the difference, this can deepen your understanding of memory-related techniques.

Background

Firstly, let me explain the background: the problematic .NET service is running on the Azure Service Fabric, which consists of a cluster of Windows Server. If you are not familiar with Service Fabric, please refer to my previous article, which explains how to develop microservices based on it. The problem is that the memory usage of this .NET service reaches roughly 1.5GB, which is 4 times higher than the average usage. Generally speaking, on the cloud more resource usage means higher cost. Next, let’s diagnose what is happening here. But before we roll up our sleeves to debug this issue, let’s first review how .NET memory works at a theoretical level.

.NET Memory Management

.NET Runtime

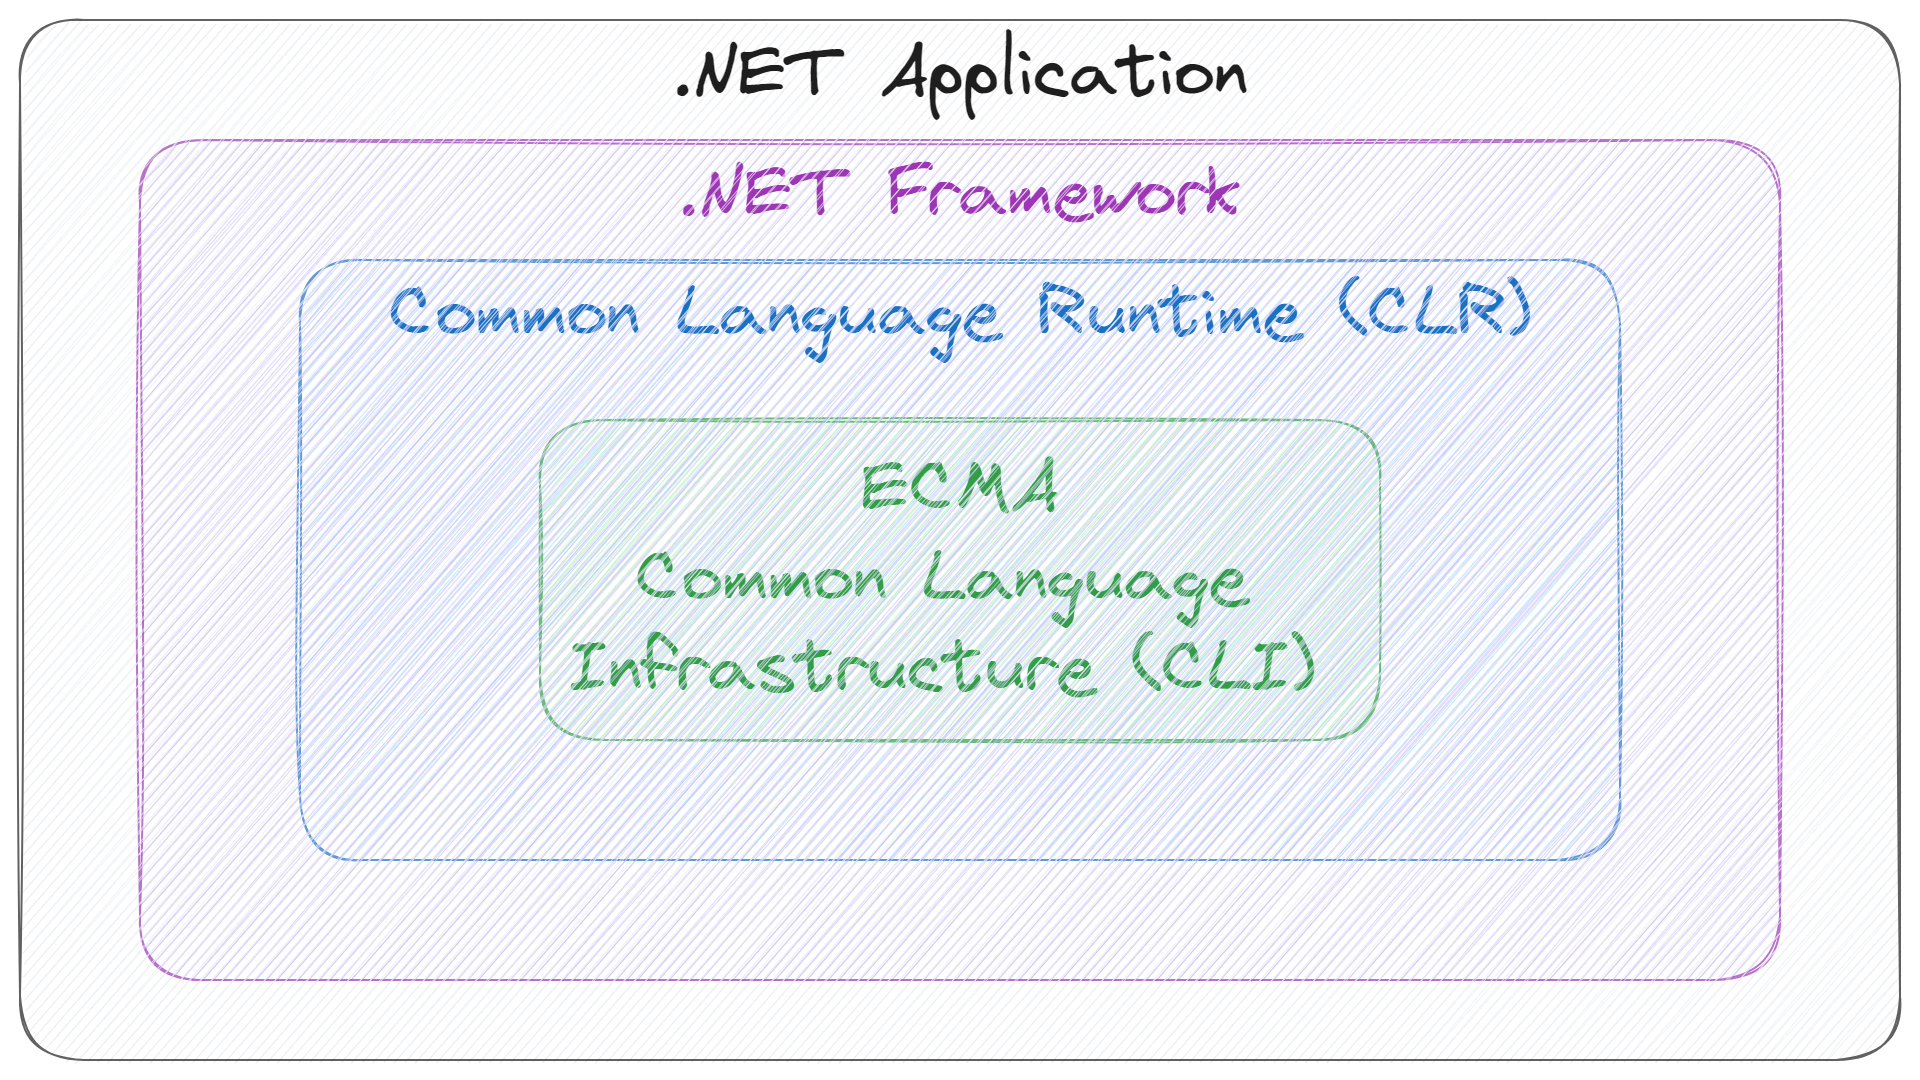
Unlike native software written directly to the operating system’s APIs, programs written with .NET are called managed applications because they depend on a runtime and framework that manages many of their vital tasks and ensures a basic safe operating environment. In .NET, runtime refers to the Common Language Runtime(CLR) and the framework is .NET Framework or .NET Core. And the .NET application is built on top of them.

CLR works as a virtual execution engine for .NET applications, and it is a very complex topic that is out of the scope of this article, so we can’t dive into the details. But one of the crucial functionalities it provides is just: memory management.

.NET GC

When you’re working on system programming with C or C++, you need to manage the memory by calling standard library’s APIs like malloc and free to allocate and release the memory. But on the .NET framework, your life will be easier since the .NET memory manager does this task for you. When the program creates a new object, the memory manager will allocate the memory for you. Easy, right? But that’s only a trivial part of the memory manager, the complicated task is how and when the memory manager can decide to collect the memory. Because of this, the .NET memory manager has another name: .NET Garbage Collector.

The .NET GC uses two Win32 functions VirtualAlloc and VirtualFree for allocating a segment of memory and releasing segments back to the operating system respectively. The entire process can be divided into the following three phases:

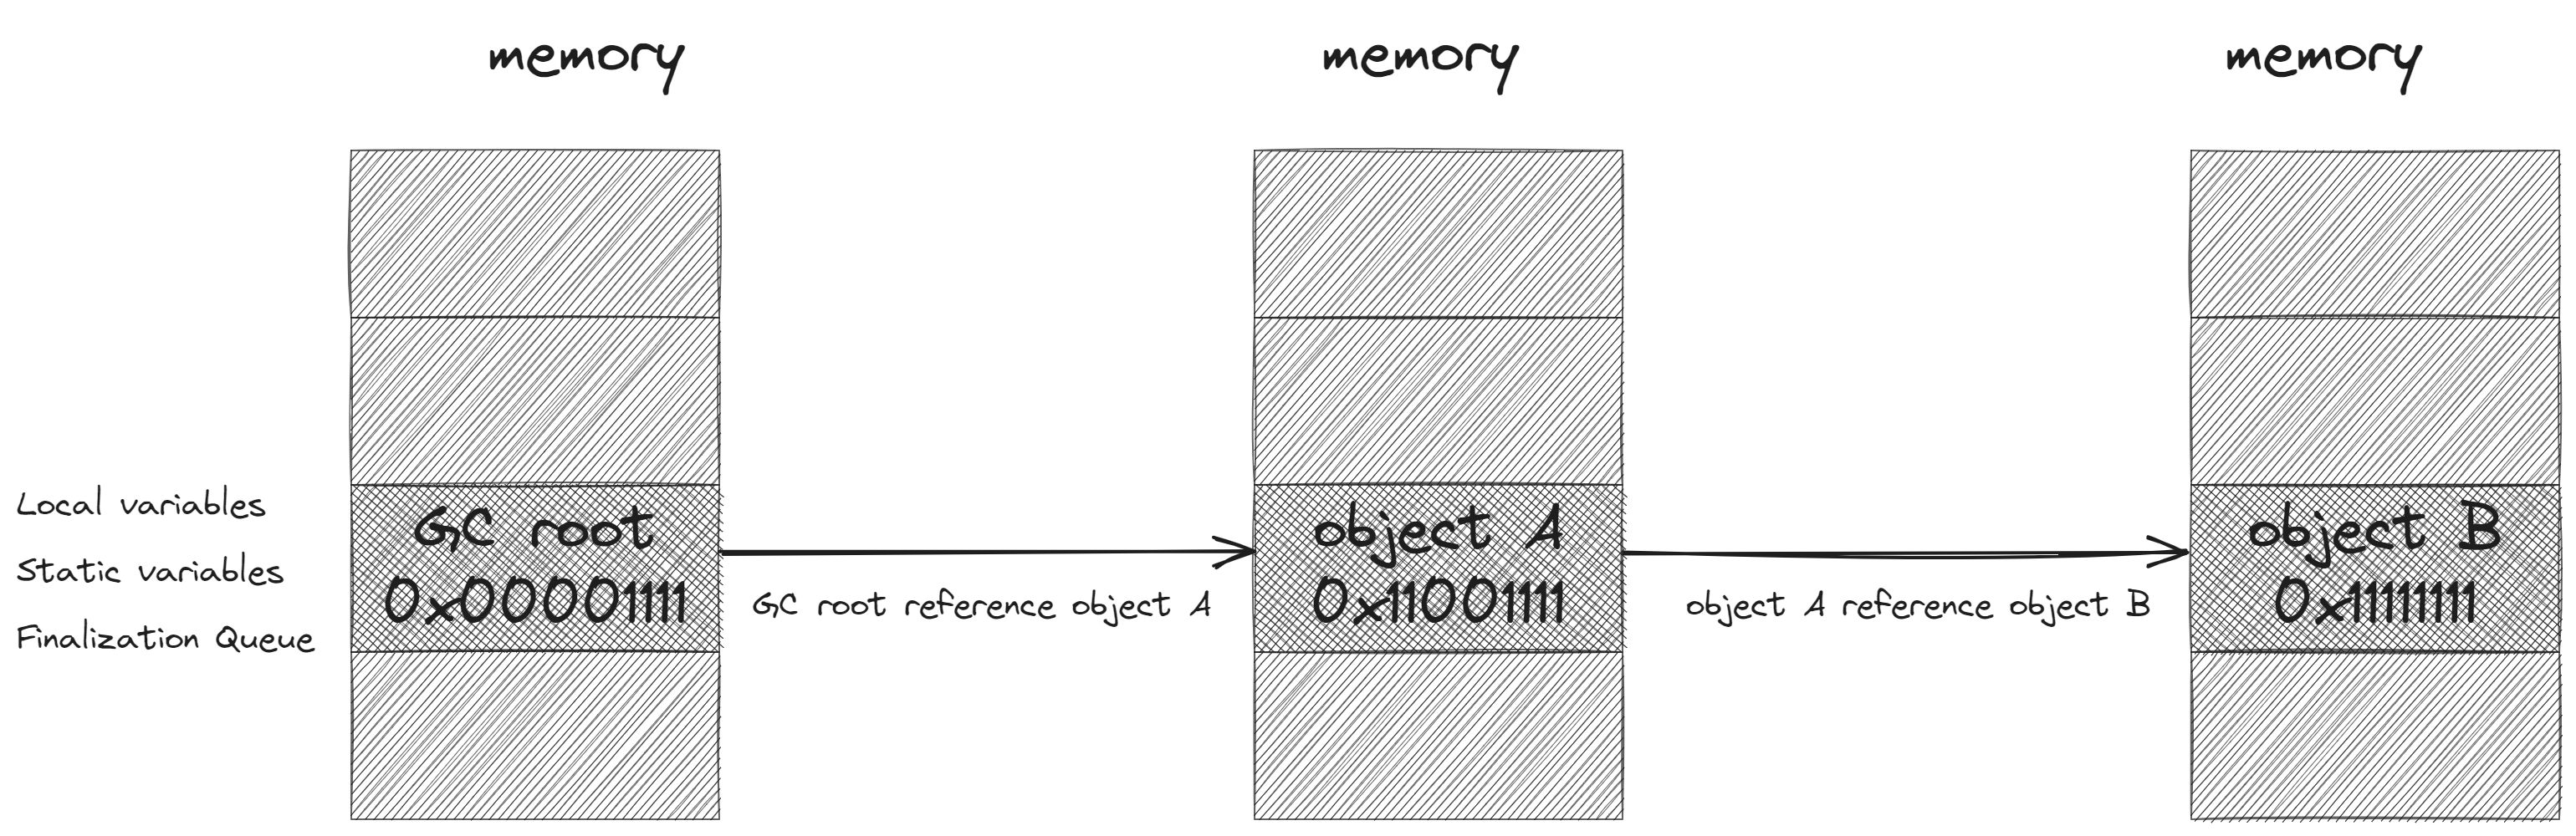
  • Marking Phase: A list of live objects is created during the marking phase. This is done by starting from a set of references called the GC roots. GC marks these root objects as live and then looks at any object that they reference and marks these as being live too. And the GC continues the search iteratively. This process is also called reachability analysis. All of the objects that are not on the reachable list are potentially released from the memory.
  • Relocating Phase: The references of all the reachable objects are updated so that they point to the new location. The purpose of the relocating phase is to optimize memory usage by compacting the live objects closer together. This helps reduce memory fragmentation and improves memory allocation efficiency.

  • Compacting Phase: The memory space occupied by the dead objects is released and the live objects are moved to the new location.

GC algorithm is a complex topic, the above description only touches the surface of it. You can explore more by yourself. In the following sections, I will add extra information when necessary.

WinDbg

To diagnose .NET applications’ memory issues, there are many modern tools, like dotMemory. But in this article, I will show you a low-level tool: WinDbg. WinDbg is a multipurpose debugger for the Windows OS, which can be used to debug both user mode and kernel mode. Originally WinDbg was used to debug the native applications, but WinDbg allows the loading of extensions which can augment the debugger’s supported commands. For example, to debug .NET applications running on CLR, we need the SOS extension.

Now that we have a powerful debugger in hand, the next question is how to use it. Generally speaking, you can attach the debugger to the problematic service, but since the target service is running in the production environment, we can’t do that easily. So we need to troubleshoot this issue in the offline style as follows:

We need to use ProcDump to dump the memory information into a file, called dump file. Then use WinDbg to analyze the dump file. I will not cover the usage of ProcDump in this article and leave it to you.

Next, let’s play with the dump file, all right? Let’s go!

Diagnose the memory leak

First, let’s use the WinDbg !address extension to display information about the memory that the target process or target computer uses as follows:

1
2
3
4
5
6
7
8
9
10
11
12
13
14
15
16
17
18
19
20
21
22
0:000> !address -summary

--- Usage Summary ---------------- RgnCount ----------- Total Size -------- %ofBusy %ofTotal
Free 338 7ffe`d06bb000 ( 127.995 TB) 100.00%
<unknown> 4715 0`feb0f000 ( 3.980 GB) 83.90% 0.00%
Stack 276 0`16880000 ( 360.500 MB) 7.42% 0.00%
Image 1241 0`0e989000 ( 233.535 MB) 4.81% 0.00%
Heap 519 0`0b997000 ( 185.590 MB) 3.82% 0.00%
Other 15 0`001cd000 ( 1.801 MB) 0.04% 0.00%
TEB 92 0`000b8000 ( 736.000 kB) 0.01% 0.00%
PEB 1 0`00001000 ( 4.000 kB) 0.00% 0.00%

--- Type Summary (for busy) ------ RgnCount ----------- Total Size -------- %ofBusy %ofTotal
MEM_PRIVATE 5051 1`1e9d4000 ( 4.478 GB) 94.41% 0.00%
MEM_IMAGE 1753 0`1013b000 ( 257.230 MB) 5.30% 0.00%
MEM_MAPPED 55 0`00e26000 ( 14.148 MB) 0.29% 0.00%

--- State Summary ---------------- RgnCount ----------- Total Size -------- %ofBusy %ofTotal
MEM_FREE 338 7ffe`d06bb000 ( 127.995 TB) 100.00%
MEM_RESERVE 2503 0`cdc3c000 ( 3.215 GB) 67.78% 0.00%
MEM_COMMIT 4356 0`61cf9000 ( 1.528 GB) 32.22% 0.00%

Let’s examine the output, which provides so much information!

The first section shows the memory Usage Summary:

  • Free: is the entire virtual memory that can potentially be claimed from the operating system. This may include swap space, not only physical RAM. For a 64-bit process, the virtual memory is 128TB.
  • Heap: what you see as Heap is the memory that was allocated through the Windows Heap Manager, we generally call it the native heap.
  • Unknown: any other heap managers will implement their own memory management. Basically, they all work similarly: they get large blocks of memory from VirtualAlloc and then try to do a better management of the small block within that large block. Since WinDbg doesn’t know any of these memory managers, that memory is declared as Unknown. It includes but is not limited to the managed heap of .NET. In my case, the value is 3.98GB which is much bigger than the 1.5GB memory usage reported by the monitor tool. I will explain why it goes like this in the following sections.
  • Image: is the memory space allocated for the binary assemblies.
  • Stack: is straightforward. If you don’t know, please refer to my previous article.

The second section shows the usage by memory Type: MEM_PRIVATE, MEM_IMAGE and MEM_MAPPED. MEM_PRIVATE is private to one process and MEM_IMAGE and MEM_MAPPED can be shared among multiple processes.

The third section shows the usage by memory State.

  • MEM_COMMIT: committed memory refers to the portion of the virtual address space that has been allocated and backed by physical memory or the paging file. Committed memory is actively used and accessible by the process. It includes memory regions that have been allocated and are in use, such as code, data, and heap allocations.
  • MEM_RESERVE: corresponds to reserved memory. Reserved memory refers to memory that has been reserved in the virtual address space but has not yet been committed. When memory is reserved, the address space is allocated, but physical memory or paging file resources are not immediately allocated. The process reserves the address space to ensure that it will be available when needed. Reserved memory can later be committed to make it usable by the process.
  • MEM_FREE: represents free memory. This category includes all memory that has not been reserved or committed.

In my case, the committed memory is 1.528GB, which exactly matches the monitored memory usage. This can perfectly explain the confusing point mentioned about the 3.98GB unknown memory segment. It turns out the majority of these memories are only reserved. So next step is to get the actual committed memory usage for various types. How to achieve that?

Thanks for the powerful address extension, I can do that by adding some filters like this:

1
!address -f:MEM_COMMIT -c:".echo %1 %3 %5 %7"

This command will output all the committed memory regions, and for each region prints its base address(%1), region size(%3), state(%5) and type(%7). The output goes as follows:

1
2
3
4
5
6
7
8
9
0x5f3a0000 0x1000 MEM_COMMIT Image
0x5f3a1000 0x2ab000 MEM_COMMIT Image
0x5f64c000 0xb000 MEM_COMMIT Image
0x5f657000 0x1b000 MEM_COMMIT Image
0x5f672000 0x2000 MEM_COMMIT Image
0x5f674000 0x2d000 MEM_COMMIT Image
0x7ffe0000 0x1000 MEM_COMMIT Other
0x4580ca7000 0x5000 MEM_COMMIT Stack
...thousands of lines omitted...

I wrote a simple script to parse the above output and finally got the following result:

1
2
3
4
5
6
7
8
Memory by Type:
type Image: 233.52344MB
type Other: 1.8007812MB
type Stack: 3.796875MB
type TEB : 0.71875MB
type PEB : 0.00390625MB
type Heap : 84.88281MB
type <unknown> : 1240.2461MB

Based on this result, you can see the majority comes from the unknown segment. I suspect that the memory leak issue occurs in this problematic service. Various WinDbg commands can diagnose the memory leak problem. And in this specific case, I find the command !finalizequeue is super helpful!

Before I show you the output of the command, let’s examine what the finalizer queue is. In C#, the finalizer(also referred to as destructor) is used to perform any necessary final clean-up when a class instance is being collected by the GC.

1
2
3
4
5
6
7
class Car
{
~Car() // finalizer
{
// cleanup statements...
}
}

When your application encapsulates unmanaged resources, such as windows, files and network connections, you should use the finalizer to free those resources.

Objects of classes with finalizers can’t be removed immediately: they instead go to the finalizer queue and are removed from memory once the finalizer has been run.

Based on this, let’s examine the output of command !finalizequeue:

1
2
3
4
5
6
7
8
9
10
11
12
13
14
15
16
17
18
19
20
21
22
23
0:000> !FinalizeQueue
SyncBlocks to be cleaned up: 0
Free-Threaded Interfaces to be released: 0
MTA Interfaces to be released: 0
STA Interfaces to be released: 0
----------------------------------
generation 0 has 66 finalizable objects (0000021c729c47b0->0000021c729c49c0)
generation 1 has 4 finalizable objects (0000021c729c4790->0000021c729c47b0)
generation 2 has 4372 finalizable objects (0000021c729bbef0->0000021c729c4790)
Ready for finalization 0 objects (0000021c729c49c0->0000021c729c49c0)
Statistics for all finalizable objects (including all objects ready for finalization):
MT Count TotalSize Class Name
00007ffcde443f78 1 32 Microsoft.Win32.SafeHandles.SafePEFileHandle
00007ffcde4407f8 1 32 System.Security.Cryptography.X509Certificates.SafeCertContextHandle

--- many lines of output omitted ---

00007ffcde447db0 97 3104 Microsoft.Win32.SafeHandles.SafeWaitHandle
00007ffcdd272468 28 4928 System.Diagnostics.PerformanceCounter
00007ffcde45d6a8 64 6144 System.Threading.Thread
00007ffcde4297c0 3639 262008 System.Reflection.Emit.DynamicResolver
Total 4442 objects

You can notice that there are 3639 objects of type System.Reflection.Emit.DynamicResolver. As we know, the objects in the finalizer queue can’t be removed until the finalizer runs. This also means that any object they reference and any object referenced by those, and so on has to be kept in memory.

This is the potential reason for the memory leak problem. System.Reflection.Emit is a low-level library used to generate the Microsoft Intermediate Language (MSIL) dynamically, my application does not rely on it. Finally, it turns out the issue is from the Service Fabric SDK and upgrading to new versions can fix it.

Summary

In this article, we examined how .NET GC works and how to diagnose the memory leak issue with WinDbg.

After graduating from campus 10 years ago, I didn’t expect that I would still be eligible for a scholarship, especially considering that I wasn’t a high-achieving student at that time. But recently, I joined one program from Linux Foundation: The Shubhra Kar Linux Foundation Training (LiFT) Scholarship Program. And very luckily, get awarded.

I plan and hope to set up a bright new career in the open-source software field, that’s the motivation to join the program!

Thanks to the award from Linux Foundation, I got the opportunity to select one training course and certification exam freely. Big thanks.

And the one I choose is CKAD (Certified Kubernetes Application Developer), stay tuned, I will update the status later.

Background

Recently, the engineering team at Amazon Prime Video posted an article that becomes super popular in the software community. Many discussions arose concerning how to design a scalable application in the modern cloud computing era.

Scalability is one critical metric for designing and developing an online application. Technically it is a challenging task, but the cloud made it easy; because the public cloud services providers like AWS and Azure do the job for you. Virtual machine, Container , and Serverless, you have so many powerful technologies to scale your application and business.

But the problem is you need to choose the one suitable for your application. So in this article, let’s examine the details of why Aamzon refactors the application and how they do it.

Since Amazon doesn’t expose the code implementation of this project, our analysis is based on the original post and the technical understanding of AWS. All right?

Case study

The product refactored is called Amazon Prime Video Monitoring Service, which monitors the quality of thousands of live video streams. This monitoring tool runs the real-time analysis of the streams and detects quality issues. The entire process consists of 3 steps: media converter, defect detector and real-time notification.

  • media converter: converting input audio/video streams to frames.
  • defect detector: executing machine learning algorithms that analyze frames to detect defects.
  • real-time notification: sending real-time notifications whenever a defect is found.

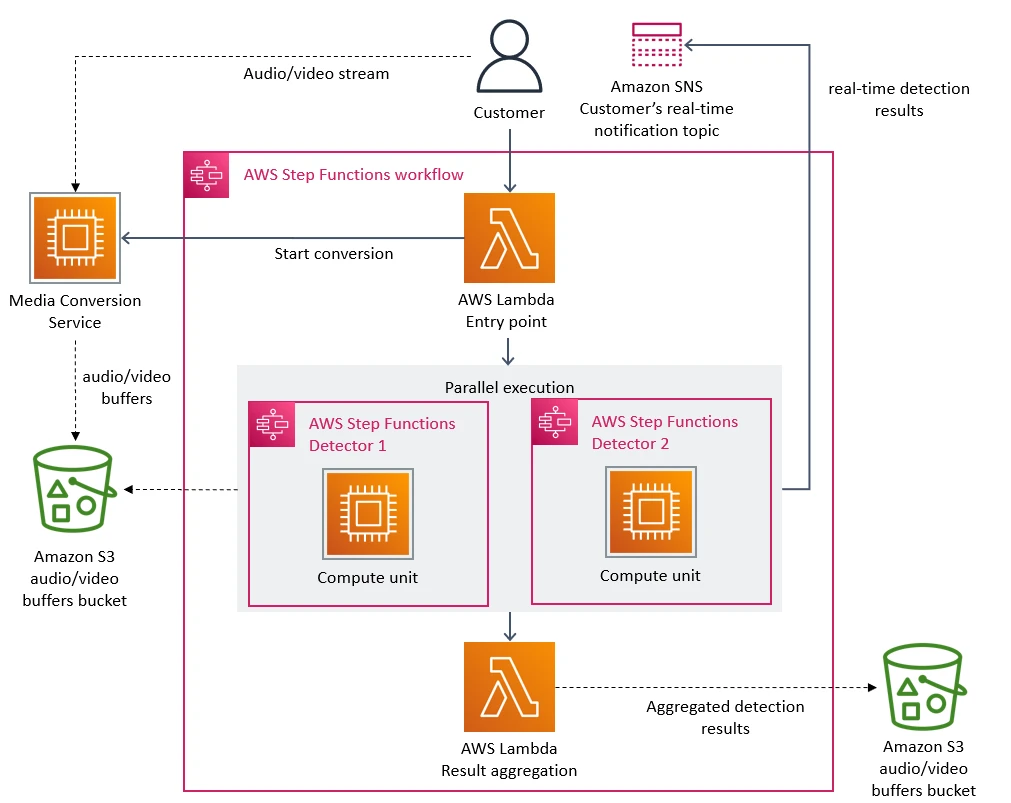
The old architecture goes as follows:

In this microservices architecture, each step was implemented by AWS Lambda serverless service (I assume you already know what is serverless; if not, please refer to other online documents). And the entire workflow was orchestrated by AWS Step Functions, which is a serverless orchestration service.

AWS Step Functions State Transition

The first bottleneck is just coming from AWS Step Functions. But before discussing the issues of this architecture, we need to understand what is AWS Step Functions and how it works basically. This knowledge is very critical to understand the performance bottlenecks later.

AWS Step Functions is a serverless service that allows you to coordinate and orchestrate multiple AWS serverless functions using a state machine. You can define the workflow of serverless applications as a state machine, which represents the different states and transitions of the application’s execution.

The State machine can be thought of as a directed graph, where each node represents a state, and each edge represents a transition between states, which is used to model complex systems. The topic of state machine isn’t in the scope of this article, I will write a post about it in the future. So far, you only need to know each state in the state machine represents a specific step in the workflow, while transitions represent the events that trigger the transition from one step to another. You can find many examples of AWS Step Functions in this repo, please take a look at what problems you can solve with it.

In theory, this serverless-based microservices architecture can scale out easily. However, as the original post mentioned it “hit a hard scaling limit at around 5% of the expected load. Also, the overall cost of all the building blocks was too high to accept the solution at a large scale.“

So the bottleneck is the cost! Because AWS Step Functions charges users per state transition, and in this monitoring service case, it performed multiple state transitions for every second of the video stream, it quickly hit the account limits!

As a software engineer working in a team, maybe you can just focus on writing great codes, but when you need to select the tech stack, you have to consider the cost, especially when your application is running on the cloud.

AWS S3 Buckets Tier-1 requests

As mentioned above, the media converter service splits videos into frames, and the defect detector service loads and analyzes the frames later. So in the original architect, the frame images are stored in the Amazon S3 bucket. As the original post mentioned “Defect detectors then download images and processed them concurrently using AWS Lambda. However, the high number of Tier-1 calls to the S3 bucket was expensive.”

So the second bottleneck is also a cost issue. But what is a Tier-1 call or request in the context of AWS S3?

A Tier-1 request refers to an API request that retrieves or lists objects in an S3 bucket, and is charged at a higher rate than other types of API requests. AWS S3 API requests are classified into two categories: standard requests and Tier-1 requests.

  • standard requests: including API requests such as PUT, COPY, DELETE and HEAD requests.
  • Tier-1 requests: including API requests such as GET and LIST requests.

Tier-1 requests are expensive because they involve retrieving and listing objects in an AWS S3 bucket, which is more resource-intensive. Because when you retrieve or list objects, S3 needs to scan through the entire bucket to find the targets. Additionally, S3 needs to transfer the data for each retrieved object over the network. So basically, it consumes more storage and network resources on the cloud.

Monolith Architecture

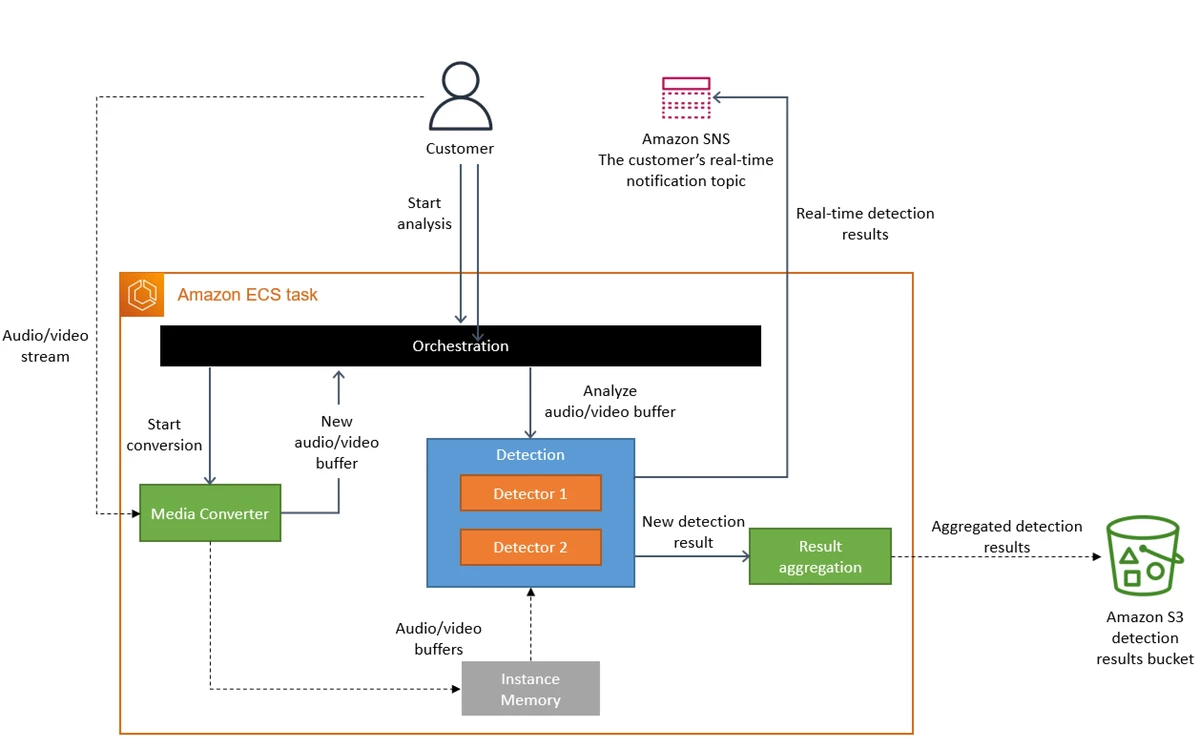
Based on these two bottlenecks, they refactored this monitoring tool and returned to the monolith architecture as follows:

In the new design, everything is running inside a single process host in Amazon Elastic Container Service(ECS). In this monolith architecture, the frames are stored in the memory instead of S3 buckets. It doesn’t need serverless orchestration service either.

How does this new architecture run at a high scale? They directly scale out and partition the Amazon ECS cluster. In this way, they get a scalable monitoring application with a 90% cost reduction.

Summary

There is no perfect application architecture that can fit all cases. In the cloud computing era, you need to understand the service you used better than before and make a wise decision.

Background

In this article, I want to introduce a distributed systems platform: Service Fabric, that is used to build microservices.

First things first, what is Service Fabric? In the software world, Service Fabric is in the scope of the orchestrator. So it is the competitor of Kubernetes, Docker Swarm, etc.

I know what you’re thinking about, at the time of writing, Kubernetes already won the competition. Why am I still writing about Service Fabric? My motivation to write this post is as follows:

  • Firstly, I once used Service Fabric to build microservices and learned something valuable about it. I want to summarize all my learnings and share them with you here!
  • Secondly, we can (simply) examine both Service Fabric and Kubernetes to understand why the cloud-native solution is better and what problems it can solve.
  • Finally, Service Fabric is still widely used in some enterprise applications, in detail, you can refer here. So the skills you learned about service fabric are valuable.

Hands-on Project

To learn the Service Fabric platform, we will examine an open-source project: HealthMetrics. This project is originally developed by Microsoft itself to demonstrate the power of service fabric and I added some enhancements to it, in detail please refer to this GitHub repo.

At the business requirement level, this application goes like this: each patient keeps reporting the heart rate data to the doctor via the wearable device(the band in this case). And the doctor aggregates the collected health data and reports to the county service. Each county service instance runs some statistics on doctors’ data and sends the report to the country service. Finally, you can get something as follows:

Before we explore the detailed implementation, you can pause here for a few minutes. How will you design the architecture if this application is assigned to you? How to make it both reliable and scalable?

Service Fabric Programming Model

Service Fabric provides multiple ways to write and manage your services:

  • Reliable Services: is the most popular choice in the context of service fabric, we’ll examine much more about it later.
  • Containers: service fabric can also deploy services in containers. But if you choose to use containers, why not directly use Kubernetes? I’ll not cover it in this post.
  • Guest executables: You can run any type of code or script like Node.js as guest executables in the service fabric. Note that the service fabric platform doesn’t include the runtime for the guest executables, instead, the operating system hosting the service fabric must provide the corresponding runtime for the given language. It provides a flexible way to run legacy applications within microservices. If you have an interest in it, please refer to this article, I will not examine the details in this post.

Next, let’s examine what are Reliable Services.

Reliable Services

As I mentioned above, service fabric is an orchestrator which provides infrastructure-level functionalities like cluster management, service discovery, and scaling as Kubernetes does. But service fabric goes further by also providing a reliable services model to guide the development on the application level, this’s a special point compared to Kubernetes. Simply speaking, the application code can call the service fabric runtime APIs to query the system for building reliable applications. In the following sections, I’ll show you what that means with some code blocks.

Reliable Services can be classified into two types as follows:

  • Stateless service: when we mentioned stateless service in the context of service fabric, we are not saying that the service doesn’t have any state to store, but it means that the service doesn’t store the data inside the cluster of service fabric. Indeed, the stateless service can store states in the external database. The naming of stateless is relative to the cluster.
  • Stateful service: similarly, the stateful service keeps its state locally in the service fabric cluster, which means the data and service are in the same virtual or physical machine. And this is called Reliable Collections. Compared with external data storage, Reliable Collections implies low latency and high performance. In the following section, I will introduce more about Reliable Collections, which is a very interesting topic. Please hold on!

Besides stateless and stateful services listed above, there is the third type of service provided by Service Fabric: Actor Service.

  • Actor Service: is a special type of stateful service, which applies the actor model theory. The actor model is a general computer science theory handling concurrent computation. It is a very big topic worthy of a separate article. I’ll not cover the details in this post, instead, let’s go through this model in the context of service fabric.

The actor model is proposed many years ago in 1973 to simplify the process of writing concurrent programs with the following several advantages:

  • Encapsulation: in the actor model, each actor is a self-contained unit that encapsulates its own state and behavior. And each actor runs only one thread, so you don’t have to worry about complex multi-threading programming issues. But how does it support high concurrency? Just allocate more actor instances as the load goes up.
  • Message passing: different from the traditional multi-threading programming techniques, actors do not share memories, instead, they communicate with async message-passing communication, which can reduce the complexity of concurrent programs.
  • Location transparency: as a self-contained computation unit, each actor can be located on different machines, which makes it the perfect solution for building distributed applications as service fabric does.

In the future, I will write an article on the actor model to examine more details about it. Next, let’s take a look at the demo app: HealthMetrics and analyze how it was built based on the programming models we discussed above.

Architecture of HealthMetrics

There are several services included in this HealthMetrics demo application. They are:

  • BandCreationService: this stateless service read the input CSV file and creates the individual band actors and doctor actors. For example, as the above snapshot shows, the application creates roughly 300 band actors and doctor actors.
  • BandActor: this actor service is the host for the band actors. Each BandActor represents an individual wearable device, which generates heart rate data and then sends it to the designated DoctorActor every 5 seconds.
  • DoctorActor: the doctor actor service aggregates all of the data it receives from each band actor and generates an overall view for that doctor and then pushes it into the CountyService every 5 seconds.
  • CountyService: this stateful service aggregates the information provided by the doctor actor further and also pushes the data into the NationalService.
  • NationalService: this stateful service maintains the total aggerated data for the entire county and is used to serve data requested by WebService.
  • WebService: this stateless service just hosts a simple web API to query information from NationalService and render the data on the web UI.

As you can see, this demo application consists of all three types of services provided by service fabric, which is a perfect case to learn service fabric, right?

In the next sections, let’s examine what kinds of techniques of service fabric are applied to build this highly scalable and available microservices application.

Naming Perspective

Naming plays an important role in the distributed system. They are used to share resources, to uniquely identify entities, to refer to locations, and so on. In the distributed system, each name should be resolved to the entity it refers to. To resolve names, it is necessary to implement a naming system.

In Service Fabric, naming is used to identify and locate services and actors within a cluster. And Service Fabric uses a structured naming system, where services and actors are identified using a hierarchical naming scheme. The naming system is based on the concept of a namespace. A namespace is a logical grouping of related applications and services. In the Service Fabric namespace, the first level is the application, which represents a logical grouping of services, and the second level is the service, which represents a specific unit of functionality that is part of the application. And the default namespace is fabric:/, so the service URI in the Service Fabric cluster is in the following format:

1
fabric:/applicationName/ServiceName

And in our HealthMetrics demo app, the URL will be something like fabric:/HealthMetrics/HealthMetrics.BandActor or fabric:/HealthMetrics/HealthMetrics.CountyService(the application name is HealthMetrics and the service name is HealthMetrics.BandActor or HealthMetrics.CountyService).

In this demo app, we build a helper class ServiceUriBuilder to generate URI as follows:

1
2
3
4
5
6
7
8
9
10
11
12
13
14
15
16
17
18
19
20
public Uri ToUri()
{
string applicationInstance = this.ApplicationInstance;

if (String.IsNullOrEmpty(applicationInstance))
{
try
{
// the ApplicationName property here automatically prepends "fabric:/" for us
applicationInstance = FabricRuntime.GetActivationContext().ApplicationName.Replace("fabric:/", String.Empty);
}
catch (InvalidOperationException)
{
// FabricRuntime is not available.
// This indicates that this is being called from somewhere outside the Service Fabric cluster.
}
}

return new Uri("fabric:/" + applicationInstance + "/" + this.ServiceInstance);
}

For detail, please refer to this source code file.

Since the behavior of the name resolver is quite similar to the internet domain name resolver, the Service Fabric Name Service can be regarded as an internal DNS service. This type of internal DNS service is a common requirement for all distributed systems, including Kubernetes. In the modern cloud-native ecosystem, the popular choice is CoreDNS, which runs inside K8S. In the future, I will write an article about DNS. Please keep watching my blog’s update.

Besides this default DNS solution mentioned above, you can use other service registry and service discovery solutions. For example, in my previous article, I once examined how to do this based on Consul. Imagine your large-scale application consists of hundreds of microservices, with the default DNS solutions you have to hardcode so many names in each service. That’s just where Consul can help. In detail, I’ll not repeat it here, please refer to my previous article!

Now that we understand how the naming system works, let’s examine how to do inter-service communication based on that.

Communication Perspective

Inter-service communication is at the heart of all distributed systems. For nondistributed platforms, communication between processes can be done by sharing memories. But the communication between processes on different machines has always been based on the low-level message passing as offered by the underlying network. There are two widely used models for communications in distributed systems: Remote Procedure Call(RPC) and Message-Oriented Middleware(MOM).

  • Remote Procedure Call(RPC): is ideal for client-server applications and aims at hiding message-passing details from the client. The HTTP protocol is a typical client-server model, so HTTP requests can be thought of as a type of RPC. In the client-server model, the client and server must be online at the same time to exchange information, so it’s often called synchronous communication.

  • Message-Oriented Middleware(MOM): is suitable for distributed applications, where the communication does not follow the strict pattern of a client-server model. In this model, there are three parties involved: the message producer, the message consumer, and the message broker. In this case, when the message producer publishes the message, the message consumer doesn’t have to be online, the message broker will store the message until the consumer becomes available to receive it, so this model is also called asynchronous communication.

The Service Fabric supports RPC out of the box. In our HealthMetrics demo app, you can find the RPC calls and HTTP requests easily. For example, when the BandActor and the DoctorActor are created, the RPC call is used in the BandCreationService as follows:

1
2
3
4
5
6
7
8
9
10
11
12
13
private async Task CreateBandActorTask(BandActorGenerator bag, CancellationToken cancellationToken)
{
// omit some code for simplicity
ActorId bandActorId;
ActorId doctorActorId;
bandActorId = new ActorId(Guid.NewGuid());
doctorActorId = new ActorId(bandActorInfo.DoctorId);
IDoctorActor docActor = ActorProxy.Create<IDoctorActor>(doctorActorId, this.DoctorServiceUri);
await docActor.NewAsync(doctorName, randomCountyRecord);
IBandActor bandActor = ActorProxy.Create<IBandActor>(bandActorId, this.ActorServiceUri);
await bandActor.NewAsync(bandActorInfo);
// omit some code for simplicity
}

You can see the ActorProxy instance is created as the RPC client, and the NewAsync method of BandActor and DoctorActor service is called. For example, the NewAsync method of BandActor goes like this:

1
2
3
4
5
6
7
8
9
10
11
public async Task NewAsync(BandInfo info)
{
await this.StateManager.SetStateAsync<CountyRecord>("CountyInfo", info.CountyInfo);
await this.StateManager.SetStateAsync<Guid>("DoctorId", info.DoctorId);
await this.StateManager.SetStateAsync<HealthIndex>("HealthIndex", info.HealthIndex);
await this.StateManager.SetStateAsync<string>("PatientName", info.PersonName);
await this.StateManager.SetStateAsync<List<HeartRateRecord>>("HeartRateRecords", new List<HeartRateRecord>()); // initially the heart rate records are empty list
await this.RegisterReminders();

ActorEventSource.Current.ActorMessage(this, "Band created. ID: {0}, Name: {1}, Doctor ID: {2}", this.Id, info.PersonName, info.DoctorId);
}

You can ignore the detailed content of this method for now, I will explain in a later section.

And when the DoctorActor service reports its status, it calls the CountyService endpoint with HTTP requests:

1
2
3
4
5
6
7
8
9
10
11
12
13
14
15
16
17
18
19
20
21
22
23
24
25
26
27
28
29
30
31
32
33
34
35
36
37
38
39
40
41
42
public async Task SendHealthReportToCountyAsync()
{
// omit some code
await servicePartitionClient.InvokeWithRetryAsync(
client =>
{
Uri serviceAddress = new Uri(
client.BaseAddress,
string.Format(
"county/health/{0}/{1}",
partitionKey.Value.ToString(),
id));

HttpWebRequest request = WebRequest.CreateHttp(serviceAddress);
request.Method = "POST";
request.ContentType = "application/json";
request.KeepAlive = false;
request.Timeout = (int) client.OperationTimeout.TotalMilliseconds;
request.ReadWriteTimeout = (int) client.ReadWriteTimeout.TotalMilliseconds;

using (Stream requestStream = request.GetRequestStream())
{
using (BufferedStream buffer = new BufferedStream(requestStream))
{
using (StreamWriter writer = new StreamWriter(buffer))
{
JsonSerializer serializer = new JsonSerializer();
serializer.Serialize(writer, payload);
buffer.Flush();
}

using (HttpWebResponse response = (HttpWebResponse) request.GetResponse())
{
ActorEventSource.Current.Message("Doctor Sent Data to County: {0}", serviceAddress);
return Task.FromResult(true);
}
}
}
}
);
// omit some code
}

In the demo app, no asynchronous communication is used. But you can easily integrate the message broker middleware with the Service Fabric. This kind of microservice design is called Event-Driven Architecture. In the future, I will write another article about it, please keep watching my blog!

Scalability Perspective

Scalability has become one of the most important design goals for developers of distributed systems. A system can be scalable, meaning that we can easily add more users and resources to the system without any noticeable loss of performance. In most cases, scalability problems in distributed systems appear as performance problems caused by the limited capacity of servers and networks.

Simply speaking, there are two types of scaling techniques: scaling up and scaling out:

  • scaling up: is the process by which a machine is equipped with more and often more powerful resources(e.g., by increasing memory, upgrading CPUs, or replacing network modules) so that it can better accommodate performance-demanding applications. However, there are limits to how much you can scale up a single machine, and at some point, it may become more cost-effective to scale out.
  • scaling out: is all about extending a networked computer system with more computers and subsequently distributing workloads across the extended set of computers. There are basically only three techniques we can apply: asynchronous communication, replication and Partitioning.

We already examined asynchronous communication in the last section. Next, let’s take a deep look at the other two:

  • Replication: is a technique, which replicates more components or resources, etc., across a distributed system. Replication not only increases availability; but also helps to balance the load between components, leading to better performance. In Service Fabric, no matter whether it is a stateless or stateful service, you can replicate the service across multiple nodes. As the workload of your application increases, Service Fabric will automatically distribute the load. But replication can only boost performance for read requests (which don’t change data); if you need to optimize the performance for write requests (which change data), you need Partitioning.

  • Partitioning: is an important scaling technique, which involves taking a component or other resource, splitting it into smaller parts, and subsequently spreading those parts across the system. Each partition only contains a subset of the entire dataset. This can help reduce the amount of data that needs to be processed and accessed by each partition, which can lead to faster processing times and improved performance. In addition to reducing the size of the data set, partitioning can also improve concurrency and reduce contention.

In Service Fabric, each partition consists of a replica set with a single primary replica and multiple active secondary replicas. Service Fabric makes sure to distribute replicas of partitions across nodes so that secondary replicas of a partition do not end up on the same node as the primary replica, which can increase the availability.

The difference between a primary replica and a secondary replica is that the primary replica can handle both read and write requests, while the secondary replica can only handle read requests. Moreover, by default, the read requests are only handled by the primary replica, if you want to balance the read requests among all the secondary replicas, you need to set ListenOnSecondary at the application code level. You can set the number of replicas with MinReplicaSetSize and TargetReplicaSetSize

And when the client needs to call the service with multiple partitions, the client needs to generate a ServicePartitionKey; and send requests to the service with this partition key. For example, the DoctorActor sends the health report to the county service with multiple partitions as follows:

1
2
3
4
5
6
7
8
9
10
11
public async Task SendHealthReportToCountyAsync() {
// omit some code
ServicePartitionKey partitionKey = new ServicePartitionKey(countyRecord.CountyId);
ServicePartitionClient<HttpCommunicationClient> servicePartitionClient =
new ServicePartitionClient<HttpCommunicationClient>(
this.clientFactory,
this.countyServiceInstanceUri,
partitionKey);
await servicePartitionClient.InvokeWithRetryAsync();
// omit some code
}

You can see the partition key is generated based on the county id field. Service Fabric provides several different partition schemas. In this case, ranged partitioning is used, where the partition key is an integer.

The county service specifies an integer range by a Low Key ( set to 0) and High Key (set to 57000). It also defines the number of partitions as PartitionCount (set to 3). All the integer keys are evenly distributed among the partitions. So the partitions of the county service go as follows:

As I mentioned above, the county id is unique, we could then generate a hash code based on the id field, then modulus the key range, to finally get the partition key. Service Fabric runtime will direct the requests to the target node based on that partition key.

Summary

In this post, we quickly examined some interesting topics about Service Fabric. I have to admit that Service Fabric is a big project, what I examined here only covers a small portion of the entire system. Feel free to explore more!

0%